Learning:
Marriage Data: It’s Complicated
D’Vera Cohn on everything you ever wanted to know about marriage data but were afraid to ask

The Census Bureau does not collect data on giraffe marriages. (Wicked Little Cake Company via Flickr)
Published in partnership with
Celebrity weddings. Legal battles over same-sex matrimony. Questions about whether today’s young adults will ever tie the knot. Debate over the consequences of single parenthood. Marriage is a topic that has it all: headline appeal, policy relevance… and a lot of data.
Marriage is also a seemingly simple subject that can be truly complicated when you peek under the hood. The complexities involved in analyzing marriage data offer a template for looking at other aspects of social change that are more nuanced than they might first appear to be. For starters, some apparently gold-plated data look rather tarnished when examined up close. In addition, the way you frame your analysis can have big impacts on the answers you get from interviewing your data. It’s also true that the demographic snapshot offered by government data does not always match the hypersonic video of life today, when even the definition of marriage changes from one year to the next.
This article will guide you through data you can find, sources for finding those data, and choices to make when you are working with statistics about marriage. My main source of data here will be the Census Bureau’s American Community Survey, which covers more than 2 million U.S. households and has full annual estimates since 2006. I’ll also touch on other products offering additional—or, in some cases, competing—information.
Where the Data Come From
The American Community Survey provides basic data about the share and number of people who are married (or not) based on answers to two different questions. The first asks how each person in the household is related to Person 1 (formerly known as the householder, or head of the household). One option is “husband or wife.” Most of the other choices are different kinds of family relatives, but options also include “unmarried partner” or “roommate.”

Household relationship question from the current Census
The second question asks directly about marital status (see below), which also allows you to tally who has been married in the past, though only among the currently single. The Bureau says common-law marriages count as marriages, and its focus-group research on same-sex couples found that people sometimes consider themselves married even if they have not had a formal, legal ceremony. In other words, the universe of married people in census data could include some without marriage certificates.
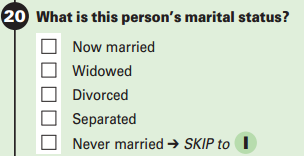
Marital status question on the Census.
Three additional questions are asked of anyone who has ever been married. Were they married, widowed, or divorced within the past 12 months? How many times have they been married? (“Three or more times” is the highest option.) In what year did they last get married? These questions, added in 2008, have value in their own right and also supply information that cannot be obtained from the marital-status question. They add data for currently married people about the length of their marriages and about whether they have any previous marriages.
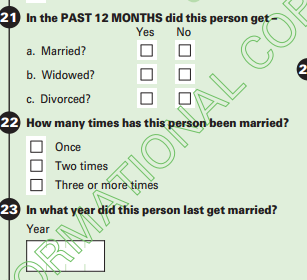
Marital history questions on the Census.
Marriage and family researchers increasingly have used the American Community Survey marriage questions because there are no other large-scale data like them. It’s true that records of each marriage and divorce are supposed to be collected by states and reported nationally by the National Center for Health Statistics. But those statistics are incomplete, and often are not more than basic counts. For example, the U.S. divorce rate trends published by the National Center for Health Statistics do not include data from California, Georgia, Hawaii, Indiana, Louisiana, and Minnesota.
States have little incentive to collect deep demographic data about marriage and divorce, because the federal government ceased funding state collection of detailed marriage and divorce information in 1996. According to a Lewin Group briefing paper (PDF), the NCHS discontinued funding to save federal dollars because some state data was of “uncertain reliability,” and because collecting marriage data was an “uneasy fit” with the NCHS’s mission and expertise. A survey of state registrars found uneven practices in data collection. One state did not collect any marriage information and three more collected only basic counts; seven states did not collect any divorce information and five collected only basic counts.
Because the quality of the numbers had deteriorated, the health statistics center’s parent agency, the Department of Health and Human Services, “approached the Census Bureau about adding marital history items to the ACS in order to have reliable and valid data” for researchers and policymakers, according to a Census Bureau report. That same report found that the ACS statistics were comparable to those collected by the health statistics center. (See the report’s figures and tables for more details.)
Despite this situation, the Census Bureau recently proposed eliminating the three marital-history questions after a review intended to prune ACS questions that are not required by federal laws or that do not have certain uses. The Federal Register published a notice saying that it would accept comments on the proposed cuts through December 30, 2014; some researchers have already raised objections to the proposal.
In addition to the ACS data, marriage-related statistics are also available each year from the Current Population Survey, taken by the Census Bureau for the Bureau of Labor Statistics. The CPS provides more detail than the ACS on how different people in each household are related to one another. Its annual numbers go back farther than those in the ACS; good data on marital status is available since at least the early 1960s. Both surveys can be combined with decennial census data to track a longer trend. The Current Population Survey is a smaller survey (its annual demographic supplement has a sample size of 99,000 households, compared with more than 2 million in the ACS) and you cannot generally use it to obtain local data.
The Census Bureau’s Survey of Income and Program Participation and the National Survey of Family Growth, a product of the National Center for Health Statistics, are longitudinal surveys. By following people over time, they can offer rich life-history details. For example, SIPP has been used to track the lifetime risk of divorce for people married in a certain era, and the NSFG has been used to compare the risk that married or cohabiting couples will split up after a child is born (PDF). (I would love to see data visualizations of these findings.) Both surveys are smaller than those of the ACS and not entirely representative of the U.S. population; the NSFG only includes people who are 15–44 years old. Basic statistics from these surveys are not as easy to obtain as those from the ACS, and even users fluent in microdata will find it challenging to use them.
If you want more details, the Census Bureau offers a handy guide to comparing data from the ACS, CPS, SIPP, and decennial census.
Gateways
The Census Reporter home page offers some easy ways to get at the ACS marriage data, especially if you are interested in looking at a particular city or state. For example, if you type “Virginia” into the box that says “Start typing to pick a place…” you can see that 35% of men have never married, compared with 35% of women. The site gives you the option to show the data in the form of numbers or charts. (Yes, there is a difference in the share of men and women currently married. One reason is that these data come from a sample survey, with a margin of error. Another is that people can be married but their spouse might be living elsewhere. And these days, the Bureau counts same-sex couples as married, so that could play a small role. More on that later.)
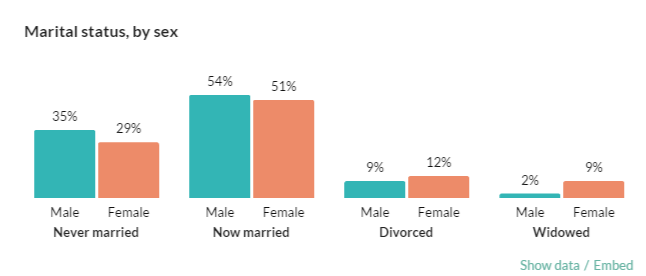
Census Reporter table of marriage stats
You also can use the ACS marriage data to look at other topics through the lens of marriage—for example, which groups are most and least likely to be married. In fact, the Bureau produces tables that let you look at marriage rates by race, birth country, labor force participation, whether someone moved in the past year, whether a woman gave birth in the past year, and other variables. A recent Pew Research Center report found that more than a third of black adults 25 years of age and older (36%) had never married, compared with only 16% of whites.
There are other types of comparisons you can make. For example, Table B12006, Marital Status by Sex by Labor Force Participation, tells you that married men (74%) are more likely to be in the labor force than men who have never married (67%). Are married men better job candidates, or might there be other reasons for the discrepancy? Maybe never-married men are younger, or more likely to be in school. It’s worth exploring the questions that arise from such comparisons.
You can also find some tables on Census Reporter by typing “mar” into the topic search box. In addition, to see what’s available on American FactFinder on the Census Bureau website, type “marital status” into the search box. If the Bureau has not tabulated the data, you can obtain it via microdata. For a primer on microdata, see Robert Gebeloff’s Source article.
Universes
Before you dive in, though, you need to make some choices about your data universe. Whom will you include in your analysis? Often, how you answer that question can have an important impact on your results.
Age
For example, the Census Bureau’s published tables (in reports and on its data portal, American FactFinder) tabulate marriage for Americans 15 years of age and older. Although very few 15-year-olds are married these days, teen marriage used to be more common. At the Pew Research Center, we prefer to compute numbers about marriage for people 18 and older.
A recent Bloomberg story used data about Americans 16 years of age and older to say that more than half of adults are single. But using the 18-and-older population, that milestone has not quite arrived. Either way, the share of married adults has been declining. Analyzing data for those who are 18 and older may make for a less dramatic headline, but it’s one that more accurately reflects today’s world.
However, it’s also harder to do calculations for a special age group than it is to use the Bureau’s preferred age range. You can make some basic calculations for people 18 and older using published data, but doing much beyond that requires using microdata. Because the choice of universe can influence your results, it is important to let your audience know about the choice you made.
When you are assembling your universe, keep in mind what it means to be “now married.” The Census Bureau’s glossary (as well as Pew Research Center practice) excludes people who are separated. But people are considered currently married even if their husbands and wives are elsewhere—be it on a business trip, deployed, hospitalized, or away temporarily for some other reason. As Paul Overberg points out in his Source article about using the ACS, the Census Bureau supplies a lot of helpful information about how it collects and edits the survey data. It is worth looking at the glossary to make sure that you are aware of the scope and limits of the data as you come up with your results.
Unit of measure
Another choice: Will your universe consist of people or households? A household consists of everyone living in a single housing unit. That could be a family, a live-in couple, one single person, a group of roommates, or some other configuration. If you look at households, “married couples have dropped below half of American households for the first time,” according to a New York Times story in 2011.
When looking at trends in the share of Americans who are married, divorced, and so on, it makes sense to talk about people. But households can be a more useful way to look at the circumstances under which children are being raised. The Times story made the point that married couples with children represent less than a fifth of households in 31 states. As this example shows, the question you seek to answer can dictate your choice of universe.
A household-based analysis is better than a person-based analysis if you want to compare people’s differing economic situations. For example, if you looked at the incomes of single individuals, but not their household income, you would not account for the growing number of cohabiting couples, who share at least some living expenses. The Census Bureau has devised an alternative measure of poverty that is intended to be a better reflection of basic living costs and people’s economic resources. That Supplemental Poverty Measure assumes that cohabiting couples split some expenses (just like married couples) and the result is that a lower share of these couples qualify as poor than under the Bureau’s standard measure of poverty.
Same-Sex Marriage
There is one area in which it is wise to be cautious about using census data about marriages: gay or lesbian married couples. The Census Bureau itself has acknowledged “significant error” in its estimates and is struggling to find a way to make repairs. As with any fast-moving type of social change, same-sex marriage has been difficult for the Bureau to capture accurately.
A major problem, according to Bureau research, is that potentially half of couples whose survey forms say they are same-sex couples are actually opposite-sex couples, so the reported number of same-sex marriages in census data overstates the true figure. This happens mainly because one spouse in an opposite-sex marriage checked the wrong gender box on the form. It happens only rarely, but even so, it can have a big impact because the number of same-sex couples (well under half a million) is so much smaller than the number of opposite-sex ones (56 million). Imagine a bowl with a giant scoop of strawberry ice cream (opposite-sex married couples) and a small dab of blueberry ice cream (same-sex married couples). When the ice cream starts to melt, the blueberry is more likely to change color than the strawberry.
To reduce these errors, the Bureau is experimenting with new wording on the question about how people in a given household are related (see below). Instead of asking whether someone is the “husband or wife” of Person 1, the Bureau is testing whether to offer “opposite-sex husband/wife/spouse” and “same-sex husband/wife/spouse.” (It is trying the same thing for unmarried partners, though the error level for that group is much lower.)
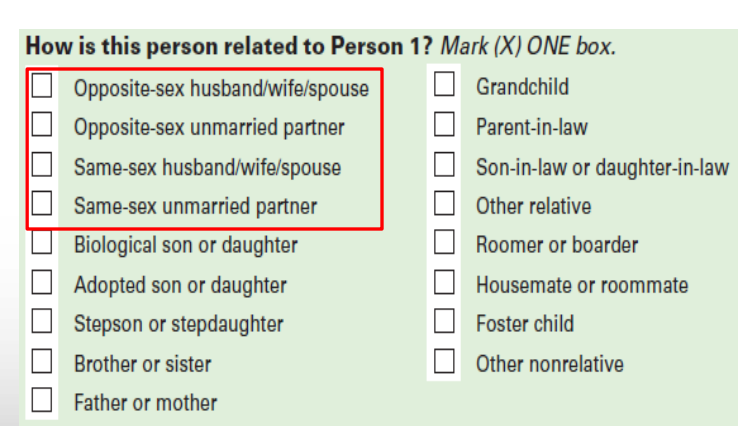
Potential new relationship question.
The Census Reporter site offers a handy guide to using same-sex couple data that links to Census Bureau research designed to improve the numbers. The Bureau’s homepage also includes a link to all its research, such as working papers on various topics.
Drawing Conclusions, Or Not
Another issue to be aware of in using marriage data has to do with causality versus correlation. That is, if two things are true, did one directly cause the other, or are they accompanying each other for different reasons? This is an important topic among researchers because it goes to the question of how far you can push your data.
There are numerous studies, for example, showing that married people not only are better off economically than single people, but also that they are healthier and that their children are less likely to drop out of school or get into trouble. For example, looking at the poverty status of children in different types of families (Table B17006), there are about twice as many children in poverty in single-parent homes as in married-couple homes. But is marriage the cause? Or could it be that people with higher earning capacity and better health, etc., are simply more likely to marry (a concept that academics call “selection into marriage”)?
The simple statistics from the Census Bureau cannot answer this question, but it is a good idea for users to be aware of the bigger picture. It’s also important not to be scared away from using marriage data just because it’s complicated. The big lesson here is just to be smart about how you analyze the data and the conclusions you draw from it.
Credits
-
D’Vera Cohn
D’Vera Cohn is a senior writer at the Pew Research Center. She studies and writes about demographics and immigration in the United States, including the uses and limits of census data. She was a Washington Post reporter for 21 years, mainly writing about demographics, and was the newspaper’s lead reporter for the 2000 census


