Features:
How We Visualized the Challenges and Limitations Facing Autonomous Cars
Our team at the Washington Post made a graphics-driven look at cars without drivers.

Self-driving car companies are competing for a driverless market valued in the billions.
Many companies tout safety as an important objective when developing self-driving cars, often citing the tens of thousands of people who die annually on U.S. roads and voicing their desire to reducing that number to zero.
We’ve seen plenty of coverage of autonomous vehicles that highlights the good and bad aspects of the technology.
What we hadn’t seen was a graphics-driven look at how the technology worked and the challenges and limitations it poses for car manufacturers and software companies like AutoX, Lyft, nuTonomy, Uber, Waymo and others testing autonomous vehicles in cities nationwide.
In April, we decided to report and develop our own visuals-driven story that not only would show the public how an autonomous car sees, thinks, and operates but also how, in some scenarios, it might not behave as expected.
We discussed the topic at length with our editors, Monica Ulmanu and Ann Gerhart, who pushed us to make this as immersive as possible. Most autonomous test vehicles on the road use a safety driver, someone who takes control of the car if something happens. That’s where we wanted to put our readers.
The project took a few months to complete, in between vacations and other projects.
We relied on a swath of documents from within and around the self-driving industry: company safety publications, autonomous vehicle disengagement reports from the California Department of Motor Vehicles, and studies from the Congressional Research Service and the University of Michigan.
We interviewed individuals from autonomous vehicle companies, academics, and other experts in the industry. We also participated in self-driving car tests in Chandler, Ariz., and San Jose, Calif.
And that was all before we started on the visuals.
We wanted our piece to simulate a scenario in which an autonomous car takes a reader to the airport, highlighting different components of the car and challenges along the way. One source of inspiration was ABC News Story Lab’s The Amazon Race. We liked how the lab immersed the reader in a role as an Amazon warehouse employee while explaining the job’s hardships and issues, all in a game.
Another project that caught our eye was Radio Canada’s visual story about the decision-making process that a self-driving car must undertake during an emergency situation. This story covered the same ideas that the Massachusetts Institute of Technology studied for its Moral Machine game, which presented the moral dilemmas an autonomous car must face, such as choosing to kill two passengers or five pedestrians, and asked the reader which consequence was more acceptable.
Prototyping
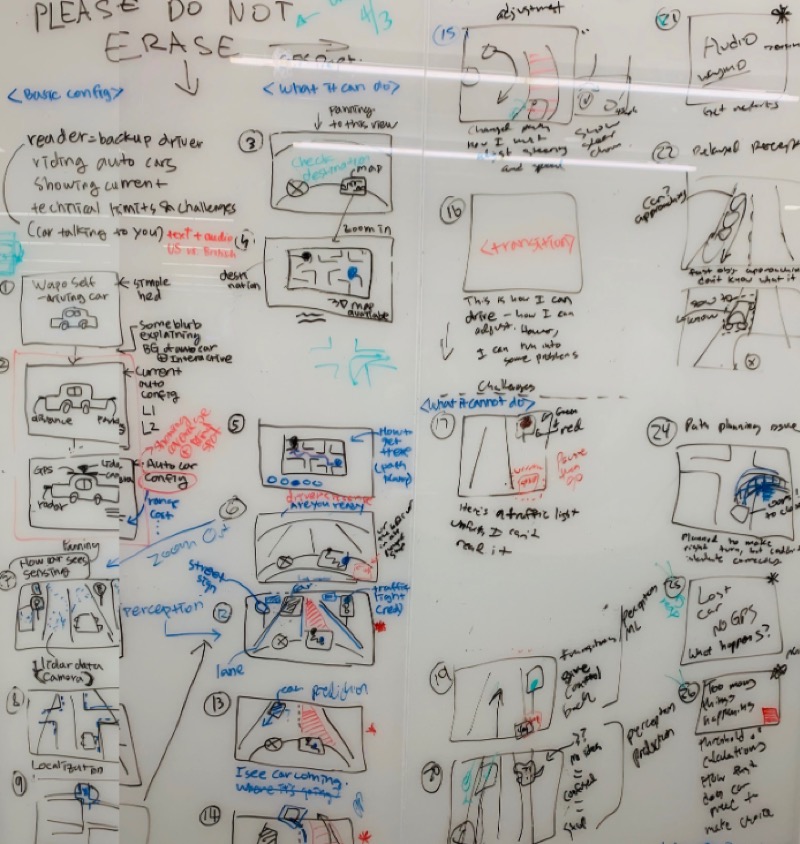
1. Whiteboard
After the initial reporting, we had multiple, ongoing discussions about what story we wanted to tell and what would be a good way to present it.
We spent several hours in one sitting to sketch our piece, scene by scene. This is a technique used by film directors who sketch every scene before doing any filming.
For visual journalists, storyboarding from beginning to end gives a bird’s eye view of the story. That way, when you go to build, you know exactly what needs to happen.
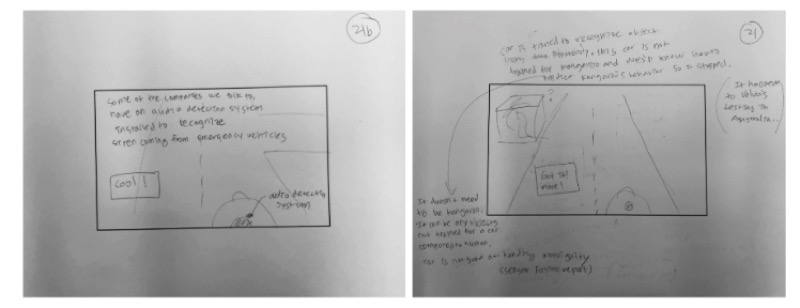
2. Paper prototyping
Drawing on the whiteboard was an essential initial process to figure out the story. However, it was still challenging for us to add specifics to each scene or update the flow.
So, we tried paper prototyping: drawing each slide onto its own piece of paper, which we learned from a video by Google’s Material Design team. This helped us include edits directly on each slide.
3. Digital prototyping
With our story structure in place, we now needed to figure out the slides’ design, such as color scheme, how the world would look, and where to place the buttons.
For that, digital prototyping was very helpful. We made a quick design draft using Sketch and pushed the draft to Invision. Once in Invision, the app allowed us to share our wireframe with other team members who could comment on it. Think Google Docs for designers. It was great visual guidance for further development.
Camera animation
In order to create an immersive experience for readers, as if they were riding in an autonomous car, we decided to make it in 3D, using the Three.js JavaScript library. We used custom 3D objects that were loaded to the page as a .glb file.
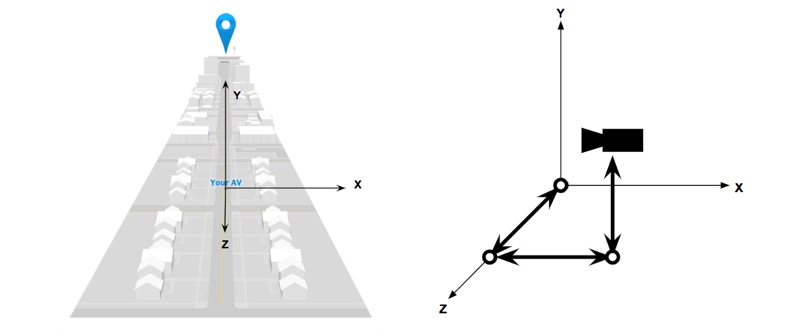
Coordinate system of the environment.
The left image is our (x, y, z) coordinate system. The location of the autonomous car, ‘Your AV’, is at the origin (0, 0, 0). The right image is showing the camera within the coordinate system. The idea was to have a camera on a three-bar linkage robot arm and move the arm instead of moving the camera itself. This virtual three-bar linkage can change its length and each joint can rotate around each axis.
The virtual linkage was made with THREE.Group(), by adding one object to the other.
Below is sample code which has one linkage and one joint. On top of the kinematics of the camera system, we used the tween.js JavaScript library to animate the transition.
let cameraZPosition = new THREE.Group();
let cameraZRotation = new THREE.Group();

cameraZPosition.add(camera);
cameraZRotation.add(cameraZPosition);
scene.add(cameraZRotation);

function moveZPos(to, tweenTime, delayTime) {
  let pos = { val: cameraZPosition.position.z }; // current position
  let tween = new TWEEN.Tween( pos )
                  .to( { val: to } , tweenTime)
                  .easing(TWEEN.Easing.Quadratic.Out)
                  .onUpdate(() => cameraZPosition.position.z = pos.val)
                  .delay( delayTime )
                  .start();
}

function moveZRot(to, tweenTime, delayTime) {
  let pos = { val: cameraZRotation.rotation.z }; // current position
  let tween = new TWEEN.Tween( pos )
                  .to( { val: to } , tweenTime)
                  .easing(TWEEN.Easing.Quadratic.Out)
                  .onUpdate(() => cameraZRotation.rotation.z = pos.val)
                  .delay( delayTime ) .start();
}
3D objects and animation
1. How we built a 3D world
We started the 3D process with very simple models, in many cases not much more than simple block shapes.
These models were quick to build and gave us basic elements to use while we wrote the story, blocked out scenes, and refined the animation.
During the production process we refined shapes and colors into more detailed models, but we still kept a “low-poly” aesthetic.
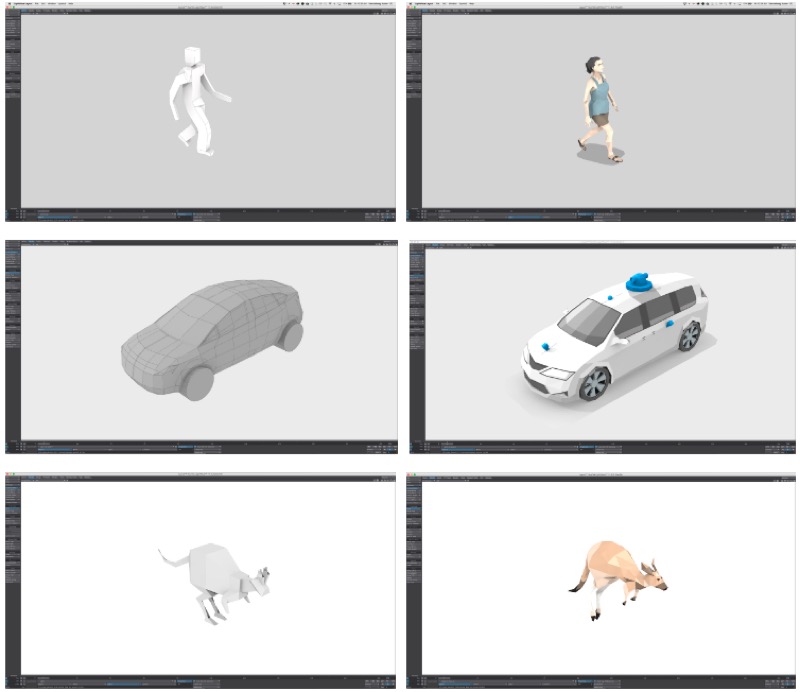
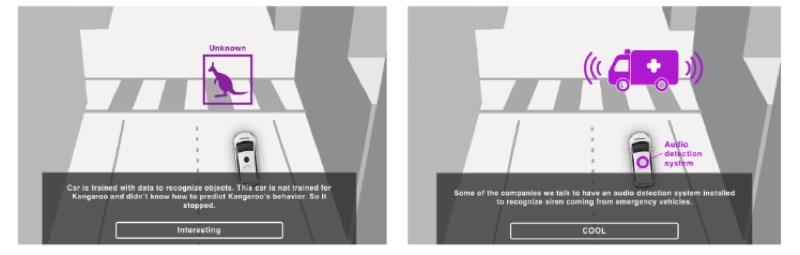
2. How we made a kangaroo jump
First, how animation was embedded to 3D objects. Most of the animation was performed in the browser using Three.js, using models we imported then moved along x and z axis. This worked fine for automobiles because the only element moving is the wheels, and with our low-poly style it was OK if those didn’t appear to turn.
But for a few models, it was important to animate individual components of the 3D object, not just simply changing its position in our virtual space, such as a person walking and biking or the kangaroo jumping.
To do this, each model had a posable skeleton and loaded either a pre-animated motion (walking or biking) or created a custom motion (kangaroo). We then baked the animations into a .glb file format, which is triggered and looped within Three.js.
The result was the appearance that the object used locomotion to traverse the virtual space.
Second, how we embedded animation works on the page. Once the movements were embedded to the 3D objects, we loaded the files to the browser using GLTFLoader. Then, we created an animation mixer that enabled the movements in the browser. As you can see in the code below, we passed the delta value to the mixer.
// animation frame
function animate() {
    let delta = clock.getDelta();
    kangarooJumping(delta);
    requestAnimationFrame(animate);
}

// kangaroo animation using delta
let mixer = new THREE.AnimationMixer( kangaroo );
mixer.clipAction( gltf.animations[ 0 ] ).play();

function kangarooJumping(delta) {
    if(mixer) { mixer.update( delta ); }
}
3. Velocity of objects
When 3D objects are traveling on the road, we’re trying to have them move with real-world speed. We had all the objects’ speed in miles per hour and converted them to a speed in our world. In Three.js, 1 unit equals to 1 meter and time is in milliseconds.
For the objects’ traveling animation, we used the tween.js library again. The basic animation function is pretty much the same as the one we used for camera animation. In order to create different types of movement, we used two different types of easing from tween.js. One was TWEEN.Easing.Linear.None and the other one was TWEEN.Easing.Quadratic. You can find a full list of easing types here.
How we improved the performance
1. We built 3D objects with fewer polygons
Early in the process, once we decided to power our virtual world with Three.js, we knew we had to keep hardware performance in mind to deliver a smooth and fluid experience.
We settled on using a low-polygon style for our models. By limiting the complexity of the models—using fewer polygons—we kept file sizes small, resulting in faster load times.
This approach gave us some artistic freedom in our representation of elements.
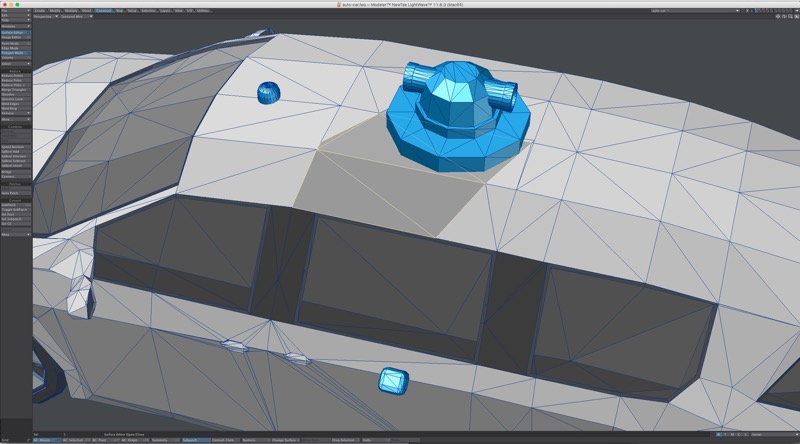
2. We used no shadow by baking shadows to the objects
Another decision we made was to not cast shadows from within Three.js because it is taxing on the browser to render.
Instead, we added shading and shadows by coloring each polygon of the model individually to give the appearance of cast shadows—such as a shadow from the lidar sensor on the roof of our autonomous vehicle. This also provided a significant savings in CPU/GPU processing.
3. Our frustum was as small as possible
Frustums are used to determine what is inside the camera’s field of view and object. Anything outside the camera’s frustum can safely be excluded from rendering. So we tried to have the smallest possible frustum for our camera.
We scaled all our models down to 1/10th their original size and adjusted our camera’s field of view and maximum distance to fit to the objects. Because we scaled everything down, we used fewer light sources. The more lights one needs to render in the world, the more processing power is needed.
4. We kept the animations short
We tried to have our 3D objects and environment ready for a better rendering performance. However, it seemed like there was more we could do. Our solution: canceling the animation.
Most of our animation is needed only for a certain duration for each slide. So we decided to not render anything after that, as shown below. The timeOutDuration value was determined by each slide. This dramatically improved our performance, but it could only be applied to animations with limited duration.
let animationFrame;
let timeOutDuration = 3000;
function animate() {
    animationFrame = requestAnimationFrame(animate);
}

let animationTimeOut = setTimeout(() => {
    cancelAnimationFrame(animationFrame);
}, timeOutDuration);
Conclusion
This project was a big undertaking for our team, and we understand not many newsrooms, especially smaller ones, have the luxury of spending months on a project that deals with 3D modeling and learning, on the fly, a complicated JavaScript library.
However, one thing people in smaller newsrooms can take away from this project is the idea of immersing the reader—breaking the fourth wall, putting them in control of an element, etc. Not only does that keep a reader’s attention, but the story will make a stronger impact.
Credits
-
Chris Alcantara
Chris Alcantara is a graphics reporter at The Washington Post, where he covers national and world events with code, data and visuals.
-
 Youjin Shin
Youjin Shin is a graphics reporter at The Washington Post, where she works as a developer, designer and reporter to create interactive stories at the intersection of politics, technology and science. She previously worked at The Wall Street Journal and was a research fellow at MIT’s Senseable City Laboratory.
-
 Aaron Steckelberg
Aaron Steckelberg is a graphics editor at The Washington Post, where he creates maps, charts and diagrams that provide greater depth and context to stories over a wide range of topics. He previously worked at the San Diego Union-Tribune, Pittsburgh Tribune Review, Atlanta Journal-Constitution, Philadelphia Inquirer and Boston Globe.


