Learning:
Handling Data about Race and Ethnicity
Or, How Matt Waite Got his Butt Kicked
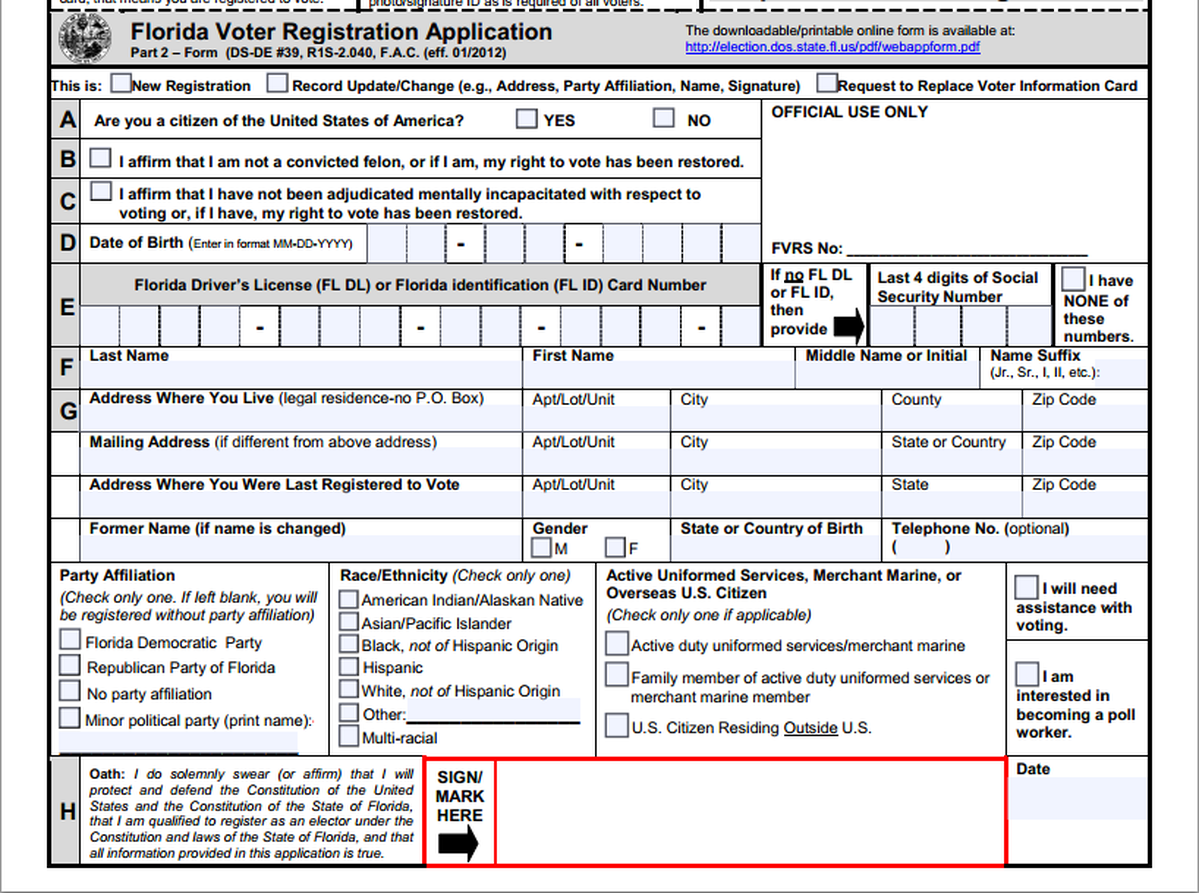
Florida Voter Registration Form
I come now to confess my sins. To wit:
- Journalists are competitive.
- I am a journalist.
- I got my butt kicked once. I’m still mad about it. And it’s an interesting data journalism problem you should be aware of before embarking on building apps.
The story starts all the way back in the dark ages of 2004 in Florida, a state still at war with itself over the 2000 presidential election debacle. Politics is everywhere, including in lists of people who can vote.
Here’s what happened. The state—led by Republican superstar Jeb Bush—decided it should purge felons who were legally ineligible to vote from the voter rolls. I could spend the rest of this case study going into the nuances here, but the tl;dr is this: The state developed a list of 47,000 people it said were felons and local elections officials should remove them. Because the list leaned heavily to the left, Democrats cried politics and disenfranchisement. We reporters set out to find out what was what. Were people improperly being stripped of their voting rights? Were felons illegally voting? And remember: the 2000 presidential election in Florida was determined by 537 votes, so removing 47,000 voters could tip an election.
So we have a big list of names and the fate of the democracy in the balance (cough). No problem. This is what data journalism is all about! Take dataset A, compare to dataset B and voila! Magic happens.
Being a competitive guy at a Florida news org, I wanted to do this big. I wanted to show how accurate or not accurate this felons list was, with statistical validity. I wanted to use actual social science to investigate it. A couple of anecdotes and a bunch of quotes wasn’t good enough for the state’s largest newspaper, the St. Petersburg Times (which is now the Tampa Bay Times). So I devised a method that would give us percentages of accuracy with a margin of error. In short, we were going to take a representative sample of names on the list—359 of them—and background check them, all in a day. Each background check cost the paper between $50 and $100, depending on how much information we needed to verify. At a minimum, we needed full names, dates of birth, previous addresses, and a criminal history from the state. I had an army of incredibly talented news researchers working with me, and by the end of the day, we found that 59 percent of the list was easily correct, 37 percent were murky, and four percent, or 220 people, were falsely being targeted for purging. We even talked to a man who faced losing his voting rights because he had the first and last name and date of birth as another man with a Florida criminal conviction. With a massive amount of work and in less than a day, we proved the state’s list released that day was flawed.
I wrote the story, watched it rocket onto the front page and went to bed that night. I expected to wake up the next day to people talking about our great story.
And when I woke up … everyone was talking about the Sarasota Herald-Tribune.
They too showed the list was flawed. But they found a different, more significant, more easily understood flaw. And side note: If you’re expecting talk-radio and television shout fests to talk about how awesome your statistical validity is, you’re an idiot. Me = idiot in those days.
So what did the Herald-Tribune find?
There were more than 47,000 Floridians on the felon purge list. Of them, only 61—that’s one tenth of one percent—were Hispanic in a state where 17 percent of the population claimed Hispanic as their race.
It’s obviously a wild and inexplicable disparity. A lot of people on the left cried foul—at the time, Hispanic voters in Florida tended to lean right, so leaving them out while purging traditionally left leaning black voters would shift the balance.
But was that why? Or was it something simpler?
Identity Is Hard
Find 10 random people and ask them this question: Is Hispanic a race or an ethnicity? Chances are, you’re going to mostly get people telling you that Hispanic is a race.
According to the U.S. Census Bureau, the nation’s official demographer, that’s wrong. Since 1980, the question of race and Hispanic origin have been separate, and Hispanic origin is an ethnicity question. This isn’t without criticism, but it’s been established policy for more than 30 years. So how does it work? Demographers recognize six races: White, Black, American Indian, Asian, Hawaiian or Pacific Islander, and other/mixed race. The question of Hispanic origin is a separate question and defines someone as Hispanic or Not Hispanic. Why? Simply put: Afro Caribbean people. Black Hispanic. Or the significant population of Asian Peruvian people. The Hispanic diaspora covers many different races of people.
Given that this distinction has been U.S. government policy for more than 30 years, you’d think that any dataset that asks the question of a person’s race would treat Hispanic origin separately. And you’d be wrong. You’d be wrong within the same levels of government. Different state agencies don’t agree on this, and forget it when you get into the county and city levels.
And this is what the Sarasota Herald-Tribune had found. In the state voter registration database, Hispanic is a race. In the state’s criminal history database, Hispanic is an ethnicity. When matched together, and with race as a criteria for matching, the number of matches involving Hispanic people drops to near zero.
This was a flaw that even talk radio people could understand.
The Solution: Get Meta
It wasn’t the last time I saw this issue. When we built Tampa Bay Mug Shots, a site that scrapes booking mug shots, everyone in the newsroom was interested in race. So we scraped that data. And, it looked good, until we looked at each county and found that three of our counties had Hispanic inmates. One didn’t. And it was the largest county in the area, with the largest Hispanic population. Uh oh. Turns out, that particular county was doing it right—treating Hispanic origin as an ethnicity—and the others were doing it wrong. Our data set was hopelessly flawed, so we tossed it. Funny enough: we were criticized for not including race information when the site was unveiled.
So, app developer, you’ve got data from two or more agencies of the government and you want to merge them together into a broader picture of your community.
What do? Fortunately, it’s pretty simple:
- Get the metadata. I know we all love that data is now on the internet, but that doesn’t mean all data is on the internet and it certainly doesn’t mean the metadata is on the internet. Metawhat? Metadata. Data about the data. How it was collected, what questions were asked, how it’s stored. It’s important and you should get it. Some places call it metadata, some call it a data dictionary. The point is, find the documentation for the data and read it. If the agency doesn’t have it, see step 2.
- Pick up the phone. Call the agency and ask to speak to the person in charge of collecting the data. Ask about the fields of data you are most interested in. How do they collect it? What criteria do they use to separate A from B? What are the possible responses? Do they throw data out? How do they decide to include data? What standards do they follow? You have to know these things.
- Basic descriptive statistics are your friends. And if you broke out in hives at statistics, it’s time to relax. Simply put, group and count. If I had done a simple group and count and looked at how many of each race were on that felon purge list, I would have saved my paper a bunch of money and myself and others a bunch of time. If you’re going to merge data from different agencies together, do some basic descriptive statistics on those fields and compare them. Counts, averages, minimums, maximums, medians, modes. Simple, basic, stats 101 stuff. If one dataset has a lot of a thing and the other has none of that same thing, that’s a giant blinking neon orange warning sign. With a buzzer. A loud one.
Race and ethnicity are tricky topics with loads of nuance and definitional difficulties. But they aren’t the only places these issues come up. Anytime you’re comparing data across agencies and across geographies, be on high alert for mismatches. Crime is a huge issue—jurisdictions have different definitions of what constitutes a big theft versus a little one, for instance. Driving laws are another—what constitutes reckless driving changes state to state. Budgets are another nightmare—what dollar figure requires a bid or not changes from city to city.
Getting the metadata, getting someone on the phone and basic descriptive statistics will help you avoid traps and hopefully let you avoid getting your butt kicked like I did.
Credits
-
 Matt Waite
Matt Waite is a professor of practice in the College of Journalism and Mass Communications at the University of Nebraska-Lincoln and founder of the Drone Journalism Lab. Since he joined the faculty in 2011, he and his students have used drones to report news in six countries on three continents. From 2007-2011, he was a programmer/journalist for the St. Petersburg Times where he developed the Pulitzer Prize-winning website PolitiFact.


