Features:
Story Recipe: Exploring Census microdata about your county
How you can use IPUMS to find stories in the intersections between community indicators

This data guide was originally published by Carolina Demography, a research and storytelling team at the Carolina Population Center.
We recently received a request from a resident in Lincoln County, NC, asking for assistance in locating data related to digital inclusion, in order to help enroll residents who qualify for the FCC Emergency Broadband Benefit.
Specifically, the reader asked us to determine the following:
- How much the acquisition of 200 hot spots in Lincoln County helped close the digital divide
- How many households in Lincoln County would be eligible for enrollment in the EBB program, based on their income level or participation in certain assistance programs, such as the Supplemental Nutrition Assistance Program, Medicaid, or Lifeline
To answer the inquiry above, we need to compile information about:
- Household internet access
- Family income and family size (used to determine poverty thresholds)
- Supplemental Nutrition Assistance Program (SNAP) recipiency
All of this is information collected by the U.S. Census Bureau’s American Community Survey (ACS) and the summary tables provide details on household computer availability and internet subscriptions, poverty status at various levels of the federal poverty line (FPL), and SNAP receipt. What the tables don’t provide is the intersection of these characteristics. To answer this, we need the microdata or individual record data.
Here’s how we went about answering this question for Lincoln County, and how you can find the same data for your county.
1. Find the appropriate PUMA (not this)
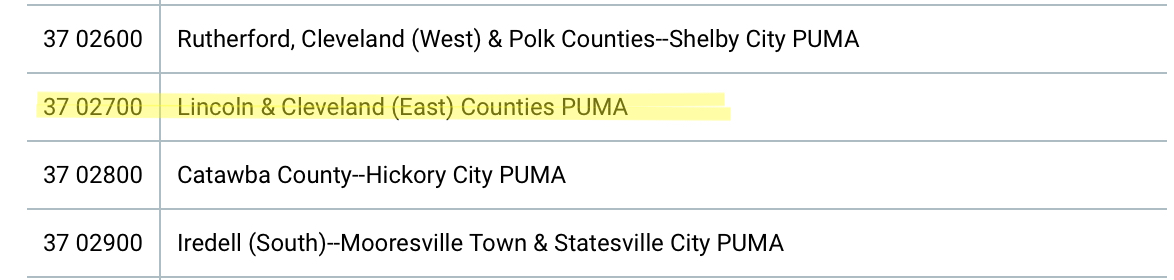
The ACS microdata is published for geographic areas called Public Use Microdata Areas, or PUMAs. Each PUMA is about 100,000 residents, which means some counties are combined with other counties to make up a PUMA. This is the current list of PUMAs in North Carolina.
Lincoln County had just over 78,000 residents in 2010, which means it’s combined with the eastern part of Cleveland County to form PUMA 2700.
2. Sign up for IPUMS
IPUMS—the Integrated Public Use Microdata Series—is my favorite data tool. Located at the Minnesota Population Center at the University of Minnesota, the IPUMS projects do the hard work of cleaning and harmonizing data sets over time. They also create some of the most common indicators—such as poverty status based on family size and income—from the underlying data, allowing researchers and journalists to spend less time cleaning data and more time analyzing and evaluating relationships.
It’s free to use (apply here for ACS data), and they have online analytical tools for their most popular databases: IPUMS-USA (Census and ACS data) and IPUMS-CPS (for the March Annual Social and Economic supplement to the Current Population Survey). This means that you can do many data analyses without a statistical software package.
3. Identify the appropriate variables
To conduct our analysis, we first need to identify the variables we need. Some of these are household variables, meaning they have the same values for all people in the housing unit. Others are person variables, meaning they can vary by person-to-person within the household.
Here’s what we need:
- STATEFIP – this tells us what state the household is located in using FIPS codes. FIPS stands for the Federal Information Processing System coding scheme. To focus on North Carolina, we’ll look just at places where the state FIPS code is 37.
- GQ – an indicator for whether the housing unit is a group living facility (group quarters or GQ), housing unit, or vacant. We want to limit our analysis to households (GQ=1 or 2).
- Information about household computer and internet availability to tell us about the digital divide. Depending on our question, this could include:
- FOODSTMP – whether anyone in the household received SNAP assistance
- RELATE – a person-level variable that describes the individual’s relationship to the household head. To focus our analysis on households, we want to look just at individuals who are the heads of household (RELATE=1).
- POVERTY – a person-level variable that determines an individual’s family income for the prior 12 months as a percentage of the federal poverty line. Pay careful attention to the codes here, because POVERTY values of 0 don’t mean “no income”; instead, they mean that this was “not applicable”, so we want to make sure we exclude those values from our analysis. Note: this is a person-level variable because poverty is calculated for families (individuals related by blood, marriage, or adoption); households can contain multiple families. For example, three unrelated college roommates are a three-person household but represent three one-person families for the purposes of calculating poverty rates.
4. Go to the online data analysis system and choose your sample
I want the most current data available, but because I’m trying to look at a very specific subpopulation within one PUMA, I also want to make sure that my sample is large enough for me to get reliable estimates. Because of this, I would typically choose the 5-Year ACS data instead of the 1-Year data for these types of evaluations. Unfortunately, the computer and internet questions changed in 2016, which means that I can’t use the 2015-2019 5-Year ACS data and expect it to contain all the variables I need. Because of this, I’m going to combine data from multiple sample years; this process is called “pooling.” To make the analysis run faster, I’m limiting my selection to just the ACS data.

Note: I could also choose my sample when I download the data and read it into the software package of my choice (Stata) or use ipumsr to read data into R, but I’m focusing here on using the online tool.
5. Create any necessary variables
Often the specific topic that I want doesn’t quite exist in the variables that are available. Instead, I need to combine the data together to create a new variable that captures what I am interested in. Whenever it’s straightforward, I err on the side of providing more detail: we can always add categories together later; disaggregating them has to be done in the variable creation phase.
Here, we are specifically interested in the intersection of computer availability and internet use. To do this, I need the variables CIHISPEED and CILAPTOP described above. First, I click on the “Create Variables” button linked in the top of the online tool.

Next, I use the expression syntax help and information on the variable codes to create a new variable. Specifically, I’m creating a new variable named hhintcomp (Household Internet and Computer) that contains the following four values:
- 1 = No high-speed internet subscription
- 2 = High-speed internet subscription, no computer
- 3 = High-speed subscription and computer
- -1 = not applicable (e.g., Group Quarters)

6. Conduct analysis
The analysis is a multi-step process, consisting of the following:
- Use selection filters to limit to elements of interest. Here we are interested in:
- Households in North Carolina (STATEFIP=37) in PUMA 2700 (PUMA=2700)
- Only household heads (RELATE=1)
- Only households, not Group Quarters (GQ = 1-2)
- Only data from 2016-onwards (YEAR = 2016-*)
- Only data from households where the head of household has a poverty calculation (POVERTY = 1-*)
*the asterisk just tells the online software to go to the end of the range. When you put it after a hyphen, it says to go to the highest value. If it is before the hyphen, it says to go to the lowest value through the number specified. - I separate each filter by a comma, which means I’ve put the following text in the selection filter: statefip(37), puma(2700), relate(1), gq(1-2), year(2016-*), poverty(1-*)
- Determine my row and column variables. Here I want to look at household computer and internet access (HHINTCOMP, my created variable) for households that are or are not receiving Food Stamps.
- Put HHINTCOMP as the row variable
- Put FOODSTMP as the column variable
- Use a control variable to show above or below 125% of the federal poverty line. We can introduce a third variable by using the “Control” section and putting the POVERTY variable there. I recoded POVERTY to meet our above/below thresholds by doing: POVERTY(r: “Below 125%” 1-124; “125%+” 125-*). The “r:” tells the software “hey, I’m going to recode this variable,” and then you specify how you want it broken up, separated by semicolons. You can label the recoded values, like I did, by putting the new value names in quotations or you can leave them off. This is going to split our output into tables for households below 125% of the federal poverty line, above this threshold, and all households.
- Choose appropriate weight. Here, because we are focused on households and I am looking just at the household head, I am using the hhwt or household weight to get estimates for the distribution of households. Here is what my inputs look like after the above steps:

- Choose output options for the table. I am focused mainly on the share of households with or without internet by poverty status (percentaging by column). But I also might need to modify my analysis, so I am going to choose the “Weighted N” to have total numbers to work with. Very important note: Because I am combining multiple years of data (here it is five: 2016-2020), my estimated number of households will be five times as large as the observed number. Because I can’t get a direct estimate of Lincoln County (since the PUMA contains Lincoln and East Cleveland), I’m interested in percentages, not the precise numbers, so this is not an issue we need to address here.
For the purposes of clean screenshots, I also turned off color coding and chose “no charts” in the Chart Options section.

- Run the table to make sure you don’t have an error in your specification and that the table looks right. I’ve attached a screenshot of my output here:

- Download CSV. If my data looks right, I can also use the online tool to download a CSV so I can manipulate numbers easily. (This is a relatively new feature and can significantly improve your workflow if you are using the online tool.)
7. Calculate percent of households meeting the conditions of interest.
If we go back to the initial question, it was about the digital divide in Lincoln County and whether we could say anything about the digital divide in households below 125% of the federal poverty line and receiving SNAP funds. Looking at our tables, we can see that:
- 92,265 weighted cases are in the “row total” for “No high-speed internet” for all valid cases.
- 30,747 weighted cases are in the “row total” for “No high-speed internet” and “Under 125%” poverty. 11,463 of these also receive SNAP funds.
- There are 259,660 total weighted cases (remember, we are combining 5 years of data, so this is essentially 5x the number of households in the PUMA overall).
Using these numbers, we can calculate that there are:
- 92,265/259,660 = 35.5% of households without high-speed internet
- 30,747/259,660 = 11.8% of households without high-speed internet and under 125% of the federal poverty line
- 11,463/259,660 = 4.4% of households without high-speed internet, under 125% of the federal poverty line, and receiving SNAP funds
8. Obtain total number of occupied households in Lincoln County.
Because our PUMA contains Lincoln County and part of Cleveland County, I can’t use it to directly estimate the number of households that meet certain conditions in Lincoln County. Instead, I first need to get the number of occupied housing units in Lincoln County. I can do this by looking at the 2020 Census data at https://data.census.gov. According to Table H1, there are 34,306 occupied housing units in Lincoln.
9. Calculate households of interest.
By combining my percentages meeting the conditions of interest (step 7) and total housing units (step 8), I can get an estimate of the number of households meeting the specified conditions:
- 34,306 * 35.5% = 12,190 households without high-speed internet
- 34,306 * 11.8% = 4,062 households without high-speed internet and under 125% of the federal poverty line
- 34,306 * 4.4% = 1,514 households without high-speed internet and under 125% of the federal poverty line and receiving SNAP funds
With those numbers established, we can then estimate the impact of distributing a given number of devices on closing the digital divide.
Credits
-
 Rebecca Tippett
Dr. Rebecca Tippett is the founding Director of Carolina Demography at the Carolina Population Center at UNC-Chapel Hill and oversees the operation of the organization. Her work helps leaders across North Carolina make sense of population-level changes throughout the state.


