Features:
The Value of Human Text Analysis: Q&A with Alvin Chang
The quick-turnaround Vox graphic that showed unanswered questions from the Kavanaugh hearings
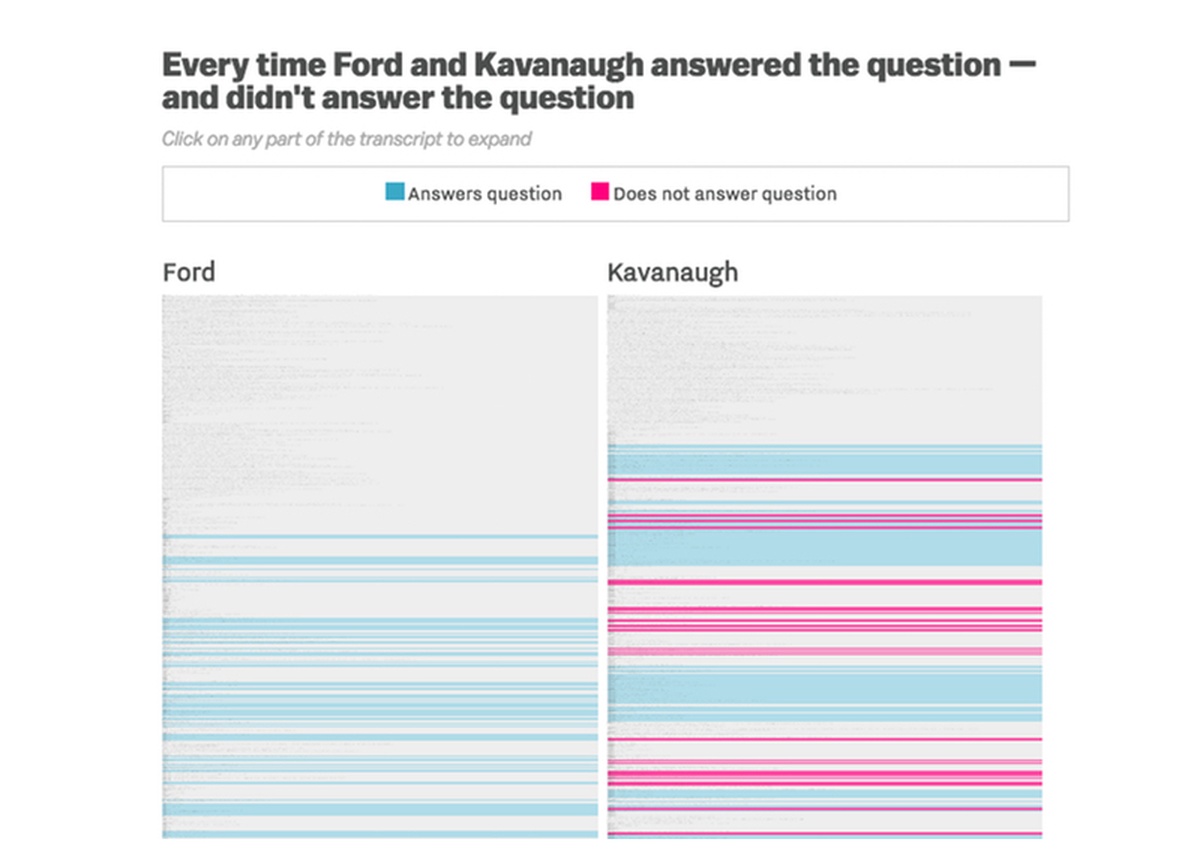
(Vox)
We spoke with Vox’s Alvin Chang about making a widely shared interactive on short notice, finding the story in a text transcript, and how to decide what counts as data. —Ed.
Q. So this piece really took off! Can you tell us what that was like, personally, for you?
It was kind of unexpected… I wrote the piece, and I posted it. This was Friday afternoon. I had to fix some bugs after that. I wasn’t really paying attention to Twitter or Chartbeat. It’s always hard to tell the scale of how viral something is going—I had a few people DM me and say, “I’ve never seen a graphic take off like this before.” But it was Friday afternoon and I was exhausted, so I stopped working and went off to my weekend. Then the next day I started getting texts from friends… I’m from Kansas, so I got texts from friends from Kansas…. and a high school teacher of mine was tweeting at me. That’s when I realized oh, this is something, this has become an image that people are really identifying with and that’s tapped into the way that a lot of people are feeling or something that they had observed… It wasn’t just Twitter-world going crazy or Vox’s audience—the image was going beyond the normal scope.
Q. You’ve started to talk about why this piece was so resonant. Can you tell us more about that, and also if any of that resonance was part of your initial motive for creating it?
I think me analyzing why it’s resonant in retrospect is kind of cheating… I was looking for something in the hearings that we could measure. That’s always something I’m looking for. Sure you could have a bunch of pundits analyzing events … but is there something that we can measure that describes what happened in a way that’s just a human analysis? I watched the entire hearing and watched all the news and talked to friends on Thursday night, and I couldn’t really put my finger on it. But I start work early, so on Friday morning I woke up and started just reading the transcripts and thought, “Oh, this is different.” While we were paying attention to stylistic differences when we watched the hearing, when I was reading the transcripts there was a real difference in content—a difference in what was being communicated by both Ford and Kavanaugh.
That was the moment I was like, this is something I can count. I can just read through this and count [times when questions went unanswered]. It’s funny that people are calling this great data journalism, and it’s literally me sitting there and going one, two, three, four.
…Even after I had made the chart and I was playing it with it (eating my cereal, in my pajamas because I had started really early that morning), I thought, I don’t know if this is a story. I don’t know if this really gets across the thing that I felt as I was reading through the transcripts. So I sent it to my editor who said, “oh yeah this is great.” When it resonated with the first person I showed and then the second person, I thought, ok there might be something there.
From what I’m hearing, I think what it captured was this argument that people are making of why one person’s testimony was qualitatively different than another person’s, but in a way that was about the content and not about the style.
We watch Saturday Night Live and a lot of that was about the style. We see a lot of analysis of what it means to yell, and what that means for optics. But I think what [this graphic] captured was: at the end of the day people are asking questions and somebody is answering questions. The hope is to get some answers. It’s really easy to get out of that framework. This tried to pop it back into that frame: Look, there are people, senators in fact, who are supposed to be asking questions to find out more information. These two witnesses are supposed to be answering questions so that we can figure out the truth of the matter.
That’s what the yardstick here was, and I think that’s the part that was pretty resonant.
Q. You’ve used the word “yardstick” which reminds me of the stacked format of it. How did you come up with that particular design? Was that something you already had in mind or did that come up that morning?
When I was at the Boston Globe in 2012 for the Obama-Romney presidential election, there was a particular debate that was very emotionally charged for both candidates and very dramatic. It was the one where both candidates were sitting on stools, and they were standing while answering questions, so they constantly interrupted each other. The morning after that I did the same thing: I was looking at transcripts and thought, I think I can show the moments in which the candidates were interrupting each other the most. Of course, because it’s a debate, there’s only a few hours the next morning where something like this stays salient in the public’s view. So I did the exact same thing, I went through and found a metric I wanted to show. Then I shrunk down the transcript font to like one pixel and gave it a background color. It’s so simple, but that’s kind of where it came from.
When this one came around, I thought, there’s a lot of text here and I want people to be able to dig into the text, to see for themselves. You know—I’m making the call on whether someone answered the question or not. I want you to be able to look at that. So that’s why I put the entire transcript in there and followed the same model. It wasn’t spur of the moment, it was something I had done a long time ago and thought this will work, and hopefully I can do it fast enough that it’s still in the public’s view. It was Friday, so Saturday was fast-approaching, and we all know what happens on Saturday to online traffic, so I thought, it’s gotta be something that’s done in the next three hours.
Q. Can you tell me more about the process of building it? Looking through the transcripts, and what you had done with the text?
After I had done the very early morning read, I read through the transcripts and put an @ symbol in front of every line where there was a question asked, from either a senator or [prosecutor] Rachel Mitchell. So that denoted every single instance where there was a question asked. It wasn’t questions like before the oath was taken, like “are you thirsty,” it was questions that were seeking information. Then I went through the transcript again, (this is just a massive text file by the way). Then I found the question and read a little before and a little after, to see what the question was hoping to get, and then whether the answer satisfied those requirements. It was really easy sometimes. So many were yes or no questions…. If there wasn’t a yes or no answer [given], if there was a long story after that, I said that was a no [“did not answer”]. So I went through and put a hashtag denoting where questions were answered properly and another symbol in front of ones that weren’t answered. Then I went through a second time to make sure I was comfortable with where everything was. From there I put it into a big HTML file and then using Javascript. I went through and said “go through every single line and if it has this symbol, color it like this and if it’s this symbol, color it the other way.” The design itself is like: “split it into two columns.” It was almost silly how simple the design itself was, but the actual analysis could be done in Javascript really quickly.
Q. Is there anything else about the design process, the colors, etc., that you could tell us about?
I make a lot of charts—there are stories of mine where I’m literally making 30 different charts. So I’ve developed a color palette that I’m comfortable with that kind of helps me drive some of the storytelling. The pink color is something I’ve always used—almost red-pink, on the border between pink and red. I’ve used that quite often instead of a straight-up red, and the baby blue I’ve used quite often. Those colors were pretty immediate. I want to use this red and then a color that’s the opposite of the red that’s not quite as vibrant…. It’s a thought process I go through pretty regularly.
Q. Can you tell us more about why you chose a red and a blue versus other colors?
Our cultural association with red is “wrong,” or it tends to be. Red is more likely to be an alarming color. Also the blue was such a faint blue, and everything else on the page is a faint gray or black. I’m not the best designer in the world, but I always have a single focal point, a single narrative i wanted people to take away. I wanted people to move their eyes through the piece starting with the red and seeing the contrast, red versus not-red. If you’re scrolling through your Twitter timeline, it’s the red that really pops out.
Q. Can you say more about that visual impact? Was there consideration of “this will look good at a distance,” like when it’s tweeted?
I had made the interactive thinking, this is going to work on every screen size, this is going to be very legible on your phone and everywhere—and then one of our designers, Amanda Northrop, pinged me and said, “I think there’s a way to create a social image that’s even more of a pop.” So a lot of the shares of this were her take on it: bumping up the fonts, squeezing the barcode down so it’s more square. Those two things made a big difference. I was looking at it on my phone taking notes to myself thinking, this really does make a difference. It’s so legible. It makes the important parts of the visual even more legible on a phone. It’s something that’s often a semi-afterthought for me, so I really appreciated her jumping in and saying we could make it better.
I would say in my timeline I saw half and half, people tweeting the social image versus people tweeting screenshots of chart itself. So now I’m having this internal crisis, do I have to change the design of something like this going forward? Is this something I should have been thinking about? Just random thoughts going through my head.
Q. I definitely see that, the social share, and then when you clicked through, you arrived at a really impactful piece. What else did you do on the tech side?
There’s kind of two parts to this, one is the Javascript I was telling you about, which goes through and marks up the text to say this is an answered question and this is not an answered question. After it generated all of it out, I copy and pasted the HTML it generated out, so the browser wouldn’t have to do that work. From there, it was like, ok, now the only actual code that runs is if you click on the chart. Everything else is straight HTML and CSS. I know there are definitely people who would be cringing at the thought of this two-step process that to them would be inefficient. I thought, I first need to see what it looks like, and I’m very fast in Javascript and HTML and CSS. And in the next ten minutes I can essentially bake out the HTML, and that’s what we are left with.
So when you click it goes from 1-pixel to 16-pixel font, and it does a little animation in between to make the font sizes bigger. This is definitely one of those pieces I’ll use to show my students, look, the amount of Javascript you need to learn to do this is all learnable in the span of 30 minutes—maybe shorter.
Q. I think that’s one of the reasons we loved it too—it’s common to see pieces that are too complicated. And that’s probably also why it runs so smoothly.
It’s the product of a time crunch but also, one of the things I learned at Vox is that it’s really important to think about how you can best get your story across to your audience. Always think of your audience. If you think: “I’m going to do this fancy thing”… what if you didn’t do the fancy thing? So many of my graphics now are flat graphics, or have no interactive elements because it turns out it didn’t need it, the reader didn’t want it. Especially when we’re covering things that are pretty fraught, there’s a lot of emotion, a lot of partisanship and anger around this thing. Having something that’s concise and clear was pretty important.
Q. Is there anything else about this piece that you wanted to tell us about, or something you’ve seen people wondering about on Twitter, that you wanted to explain?
There are two things. One, going back to the point of how simple it is. I’m counting. The math is literally yes or no. It’s such a binary thing. But that’s data. We don’t often think of text and categorization and transcripts as data. But data is virtually anything that provides some kind of quantitative answer. That’s something I’ve tried to stress to other folks. But it’s also hard, it’s scary when you don’t have numbers in front of you to churn through a pivot table or something.
The other thing is: I don’t think I was comfortable with this story until I went through this transcript the third time, that morning. I don’t think I had it because I didn’t know if my categorization would hold up to scrutiny. I didn’t know if my categorization was okay. The standard was “is the question answered without any obfuscation?” I think someone else could have gone through this and done some categorization slightly differently, like they might think that Kavanaugh answered a question that I thought he didn’t answer. But I wanted to be very transparent in the methodology, and say “I categorized this, and you can click on it to check my work.” It was both really scary for me because it’s my judgement on the line, but also it’s a valuable service to be a human categorizer. It’s something that researchers do quite a bit and something that we as journalists have trouble doing sometimes. It’s something I’ve been trying to get better at…. it’s something I actually did yesterday for a follow-up piece. Those are the two things I’ve been thinking around the takeaways from this.
I would consider this data journalism, but if we were to backtrack to Thursday, I would have been like, “what data piece is there to do on this?” It really took asking, “What can be measured here? What can we quantify here? What can we count here?” That’s how we got from point A to point B.
Organizations
Credits
-
 Alvin Chang
I’m a senior graphics reporter at Vox, covering policy and politics with data, charts, and cartoons. I’ve also been a data journalist at the Boston Globe, Connecticut Mirror, and ESPN, and I have a master’s degree from NYU’s Interactive Telecommunications Program.
-
 Lindsay Muscato
Editor of Source from 2015-2020


