Features:
Introducing Workbench, an Open Source Platform
We made a data journalism tool so that anyone, at any level, can create and learn.

Workbench is a new open source platform that enables all stages of data journalism: getting data (including scraping), then cleaning, analyzing, visualizing, and sharing it. All of this is possible without code, yet everything you do in Workbench is automatically documented and reproducible.
A quick introduction to Workbench.
Built by Jonathan Stray, Pierre Conti, and Adam Hooper, Workbench was released in public beta at SRCCON last June and has matured into a powerful data processing environment. Here are some awesome things you can do with it now, for free.
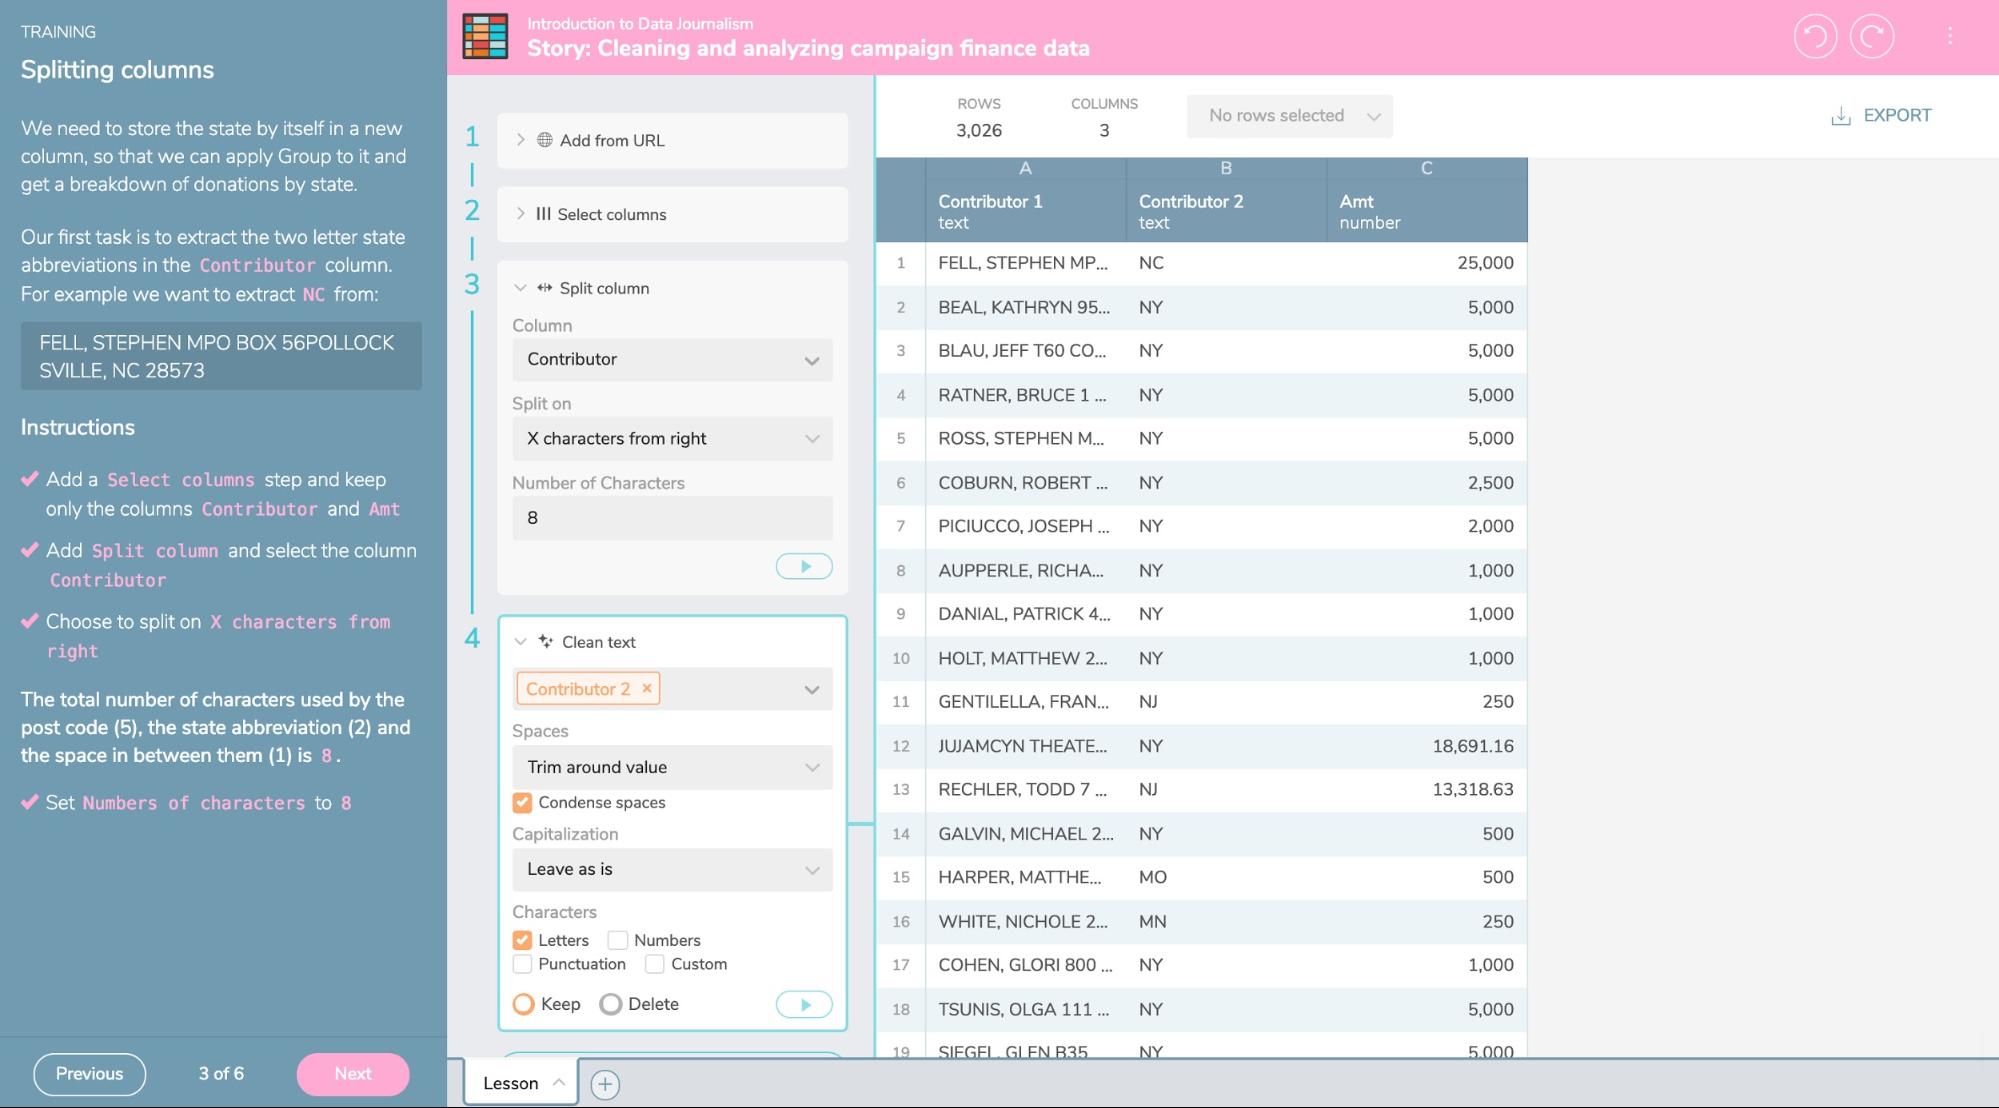
Learn Data Journalism
Workbench is not just about getting work done, but learning as well. Last month we released our first interactive course, Introduction to Data Journalism. It’s a twelve-part course which goes from the very basics (minimum and maximum, averages) to sophisticated techniques (formulas, joins) including walkthroughs of a number of real-world stories we collected in newsrooms.
Analyze Twitter Data
Workbench includes connectors for several popular data sources, including Census data and Twitter. You can use Workbench’s Twitter connector to retrieve all tweets from a specific user, from a list of users, or matching a search query. In accordance with Twitter’s API terms, you can only retrieve the last 3,200 tweets for a user or 1,000 for a search query, but you can collect all matching tweets going forward by turning on automatic updates.

You can use Twitter’s query language to more precisely select the tweets you want, including by time and location. To remove retweets, add “-filter:retweets”, like this workflow does.
There are a number of useful ways to analyze this data in Workbench, including sentiment analysis and word clouds. Or you can download your tweets, just like you can export data at any step.
Scrape a Site
Workbench includes several different types of scrapers. To load data from tables on pages, use Scrape Table. This doesn’t work on all tables on all pages, because it depends on the data being formatted in an HTML table element, but many pages will work. (For fun, try any Wikipedia page with a table.) If there is more than one table element on the page, you can use the “Table position on page” parameter to select the one you want.
For more advanced scraping, Workbench also supports xpath, a language for selecting elements on a web page. Here’s an interactive tutorial on doing this type of scraping in Workbench.
More scrapers are coming soon to Workbench, including tools to handle paged results, forms, and point-and-click selection of the elements to scrape. Make sure to follow us on Twitter to be the first to know when new features are released.
Monitor for Changes
All steps that add data can be set to automatically update, as you saw in the Twitter example.
To turn on alerts, press the little bell button in the upper right of any step. This will send you an email whenever the data changes.
Note that all steps—not just those that add data—can monitor for changes. The alert will be triggered when the step’s output changes. This means you can use Workbench’s filtering and analysis tools to create custom alerts.
For example, this workflow monitors the City of Atlanta’s audit reports with a scraper, searches for all with “Contract” in the title, and alerts the reporter when any are added or removed.
Or, you can put an alert on a Burst Detector step to detect unusual activity on a Twitter account—like the local fire department tweeting three times in ten minutes.
Clean Dirty Data through Clustering
If you’ve done any amount of data journalism, you’ve probably run into the problem of values that mean the same thing but don’t quite match, like “US” vs. “U.S.” or “McDonalds” vs. “McDonalds Inc.” or slightly different spellings of the same name. This is especially a problem for counting or grouping records.
Open Refine pioneered a clustering technique for cleaning such data, and Workbench includes the Refine step which operates similarly. You can manually choose values to merge into each group.
…or press the Cluster button to get a list of suggested merges and clean thousands of rows in a minute.

Workbench shines when you need to combine any of those steps into reusable workflows. Here’s a workflow which finds the largest landlords in San Jose, California. First, it uses the Scrape Table step to load and save a massive table from the city government’s site, containing all multi-unit housing permits. Then, it uses the Refine step to merge variations of the Owner column.
The original table is updated weekly, but by setting Scrape Table to fetch any new data published, we set the workflow to automatically clean the data and update analysis and chart —even when embedded.
Joins
Many stories are the result of combining information from two tables. One famous recurring story compares a list of school bus drivers to records of convictions for drunk driving. Joins are also known as VLOOKUP in spreadsheets like Excel.
In Workbench, joins operate between tabs. Load one table on each tab, ensure that the columns with matching data also have matching column names, and add a Join step.
Join can also be used to do things like turn state abbreviations into full names, lookup codes that are defined in another table, or collect only those rows matching specific years. One of Workbench’s data journalism lessons adjusts teacher salaries for inflation by joining with a table of Consumer Price Index data.
Show Your Work
Everything in Workbench is designed for sharing, reproducibility, and transparency, because every change to the data adds a step to the workflow. You can share a workflow with specific colleagues, or with anyone who has the link. Or you can embed live visualizations in your stories, which will link back to the source workflow so that readers can see where you got your data and what you did with it, as this story on California wildfires does. And whenever you are looking at a workflow, you can click “Duplicate” to instantly make your own copy—just like forking code, but without the code.
How to Get Started
You can sign up for a free account, and get started with Workbench right now.
We’d love to hear from you! Feel free to request features, send feedback, schedule a workshop, contribute code to the project or just share workflows you’ve created with us so we can feature them in the app for the community to get inspired and re-use them.
Send us an email here: pierre@tablesdata.com.
Organizations
Credits
-
 Pierre Conti
Co-founder & CEO of Workbench. Pierre has a background in documentary filmmaking, marketing and design. He is passionate about access to information, cultural production, and thinks of data as a medium to tell stories about systems.
-
 Adam Hooper
Co-founder & CTO of Workbench. Adam dances between computers and journalism to decipher the world. He has broken stories and built websites for Canadian, Rwandan, Tanzanian and American news agencies. He’s passionate about everything he doesn’t understand yet.
-
 Jonathan Stray
Co-founder & Advisor of Workbench. Jonathan is currently working as a research scholar at Columbia Journalism School. He has written for the New York Times, Associated Press, Foreign Policy, ProPublica, and Wired.


