Features:
How We Rebuilt the Wall Street Journal’s Graphics Team
Combining forces, embedding specialists, and busting out of the news cycle

New life emerges from careful restructuring. (Andre Vandal)
The Wall Street Journal recently took steps to merge our print graphics department with our interactive team. Our new team is simply named Graphics.
This brought a number of major changes to our department like:
- no more division between print and online graphics teams
- a new Enterprise Visuals team that pitches their own projects outside the daily news cycle
- embedded developers who sit beside section editors and reporters
Many other organizations are undergoing similar changes. Below are some major takeaways from our recent overhaul that I hope will prove useful to other newsrooms.
From Skill-First to Story-First
As in many other newsrooms, our teams were organized by their end product. The graphics artists who used Adobe Illustrator to make print graphics were on one team; the developers making interactive graphics were on another.
When breaking news happened under our old structure, our print and interactive graphics teams launched into action—but independently of each other. At some point, we’d decide how print work would translate online, or vice versa. It caused two problems: we were squandering resources by doubling up on work, and our work was usually suited for just one medium.
When news broke about the missing Malaysian Airlines plane, our graphics editors created a series of maps for the print deadline. But online, we just published those maps in a simple gallery. We were missing opportunities to create more ambitious work because the print and online workflows were so separate and heavily focused on the news cycle.

Print charts for breaking news would be published online in galleries like these.
Under the new structure, more than 30 graphics editors work on either the Core or Enterprise team without considering print or online. At some point, we still need to publish to a specific medium, but it’s not the first question we have to ask. Instead we’re focusing on storytelling from the start: doing research, crafting the narrative, thinking of the best visualizations that emphasize the story we want to tell.
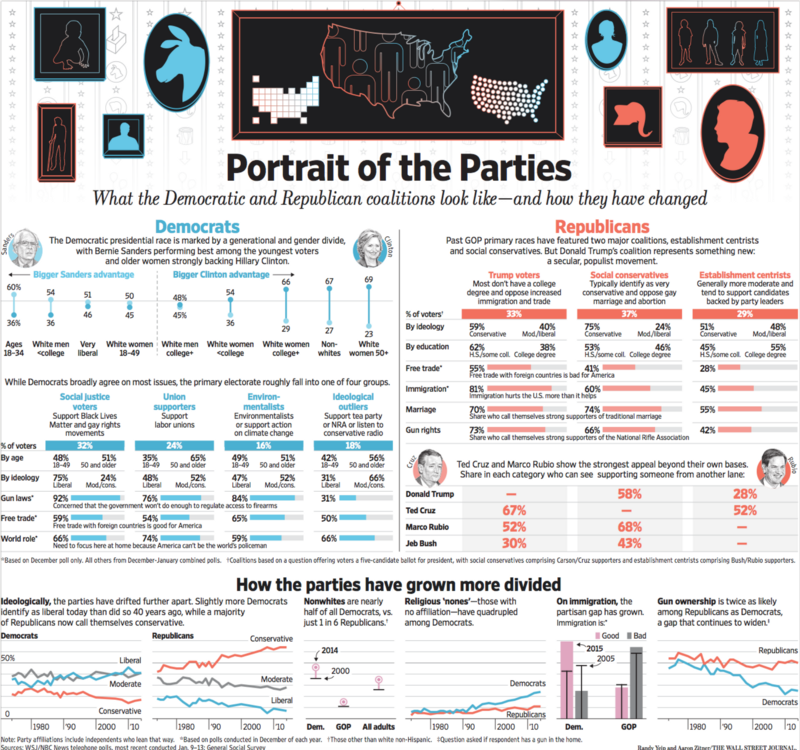
For example, our “Portraits of the Parties” series dove into the demographics of the Republican and Democratic parties. What could voters tell us about how the election was unfolding?
We started with a text script and brought together graphics editors Randy Yeip and Julia Wolfe to brainstorm visual ideas.
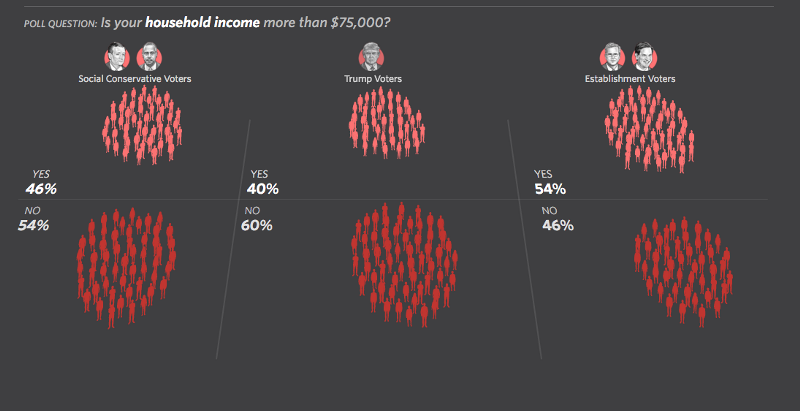
The visualization for “How Trump Happened” grouped Republican voters into three tribes: social conservatives, establishment voters, and those who supported Trump.
Under the old structure, the project would have likely been created for print or online—then adapted for the other medium late in the game.
And they definitely would have been created separately. This time, they got together and brainstormed visualizations for each medium. For web, they decided to animate people moving between distinct groups through several slides. For the newspaper, they presented several views of the data in a big splash presentation.
In print, all three section appeared at once. While the branding was the same, there was very little overlap in the how the data was visualized in print and online.
From Siloed to Embedded
Graphics desks often struggle with being a “service desk” for print sections. Over a year ago, we started moving some developers from our department to specific desks. Now we have around half a dozen graphics editors and developers embedded with several sections around the building.
For example, there’s one news apps developer who sits near the U.S. editor and develops projects directly with people on that desk, working with the visual editor who coordinates all visuals for the section (including photos and page design).
The decision was made to address how disconnected graphics teams can feel from the newsroom overall. Now, instead of prodding the graphics team for help on a project, sections can consult directly with a graphics editor who’s essentially on their own team.
This lets graphics editors develop deep knowledge about the section — and the people who work there. Now it’s only natural for them to be involved at the very start of the storytelling process, helping craft the story instead of being the cherry on top.
We believe developing institutional knowledge with the subject matter—and being on a first-name basis with people across the newsroom—is key to creating strong work on a daily deadline.
Stronger Emphasis on Enterprise Graphics
We’ve discovered some of our most successful projects come from within the Graphics team itself, like our award-winner visualization on infectious diseases, which started with a single graphics editor and eventually won “Data Visualization of the Year” at the Data Journalism Awards.
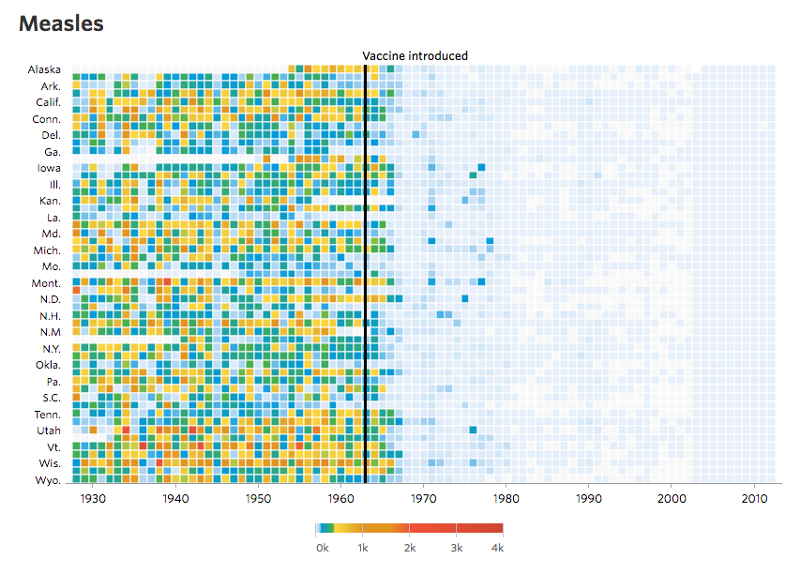
This visualization on vaccines originated from within the Graphics team. It won “Data Visualization of the Year” at the Data Journalism Awards.
While we’ve committed more people to the general newsroom, we also branched off a smaller group of graphics editors and visual reporters to work outside the news cycle. We call this the Enterprise Visuals team.
We made this decision so we could give authority and freedom to graphics editors to choose projects that make strong visual stories. It gives power to people with a visual brain to decide how graphics help tell the story. The setup also gives us more runway to develop ambitious visuals without worrying about the daily news deadlines (these projects are now handled by the Core team).
We’ve found removing some of us from the pressures of a daily product fosters new levels of ingenuity and creativity. It’s a lesson that the newsroom overall has already learned: you need both daily beat reporters and feature writers. This team gives us room for our visual journalists to be journalists.
Logistically, it also allows us to define our own deadlines to give us enough room to be creative. We also have broad leeway to create and pitch projects that excite us, focusing on stories that are visual by nature.
One of our first projects was this analysis of Iowa caucus voters (which also appeared in print). It was conceived, pitched and created entirely on the Enterprise Visuals team with support from the broader network of journalists and editors in the newsroom.

One of the new team’s first projects was this analysis of caucus voters in Iowa.
All these changes allow us to assign people to work along different timelines.
Our embedded developers work alongside desks to find better ways to respond to news and develop a better understanding of specific beats.
Our Enterprise team can work on more ambitious projects. They own projects, select news topics that are ripe for visualization, and have more control of the creative process.
We’ve already seen some of the impacts of this change:
- our graphics editors are pitching new stories each week
- we’ve stopped doing many lower-value dashboards and data dumps in favor of projects that have strong narratives
- we’ve freed up more time to fine-tune graphics, without distractions from the daily news cycle
Going forward, we’ll have to measure the success of this change based on the quality of the journalism we produce. If our work is smart, original, and focuses solely on telling powerful visual stories, we’ll succeed.
Here are two more examples of work released after our overhaul, from both Enterprise and Core teams.

Many Enterprise projects have been focused on the election. These include a look at Donald Trump’s vice-presidential options.
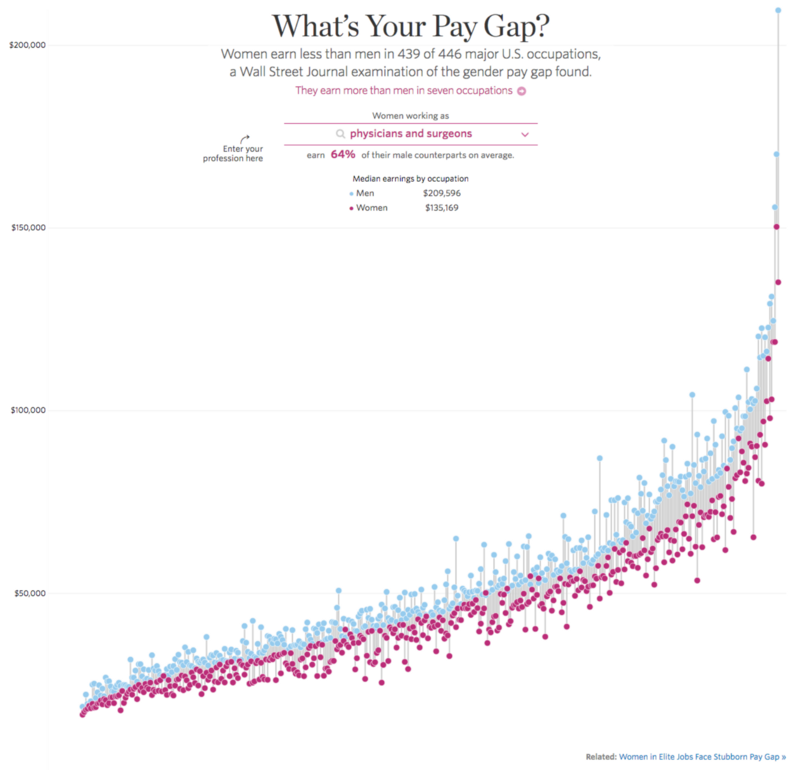
This graphic on the pay gap between men and women across professions was completed by our Core team to accompany a story.
Organizations
Credits
-
Stuart A. Thompson
Graphics director, @nytopinion. Visual stories, not stories with visuals.


