Features:
All About CSV Fingerprint
Victor Powell talks about the tool’s inception, inner workings, and potential
Last week, a new tool called CSV Fingerprint dropped and got some very positive early attention. We chatted with Victor Powell, CSV Fingerprint’s creator, about how he made it, how to use it, and how it can help you get eliminate Excel from your workflow at last.
Q. What sparked the creation of CSV Fingerprint?
It evolved out of a series of conversations with my friends Ian Johnson and Kai Chang focused around ways we could “kill Excel.” Excel can be a huge pain to work with, especially when dealing with data formatting. CSV files, on the other hand, are an oddly simple and convenient file format. Almost every program can read or write a CSV file. With that said, errors seem to pop up unexpectedly often in tabular data and there’s no simple check you can run to know if your data is how it should be. Every use case is different. For example, depending on your data, occasional empty values might be expected but other times empty values might indicate an error in the way the data was formatted.
Q. How did you build it? (And did you run into any particularly weird or interesting tech or design challenges along the way?)
The visualization was built using D3 along with the D3 fisheye plugin, and AngularJS.
There were some interesting performance issues that were solved using the HTML5 canvas API instead of SVG. Originally, the fisheye effect ran very slowly but I came up with a “hack” that involved creating a base canvas that never changed after the first drawing. Then, another canvas was used to only draw the portion effected by the fisheye effect while the mouse was dragged. JavaScript itself is surprisingly fast. Large changes to the DOM or drawing many shapes to the canvas is what slows things down the most.
Q. How easy is it to get started using CSV Fingerprint?
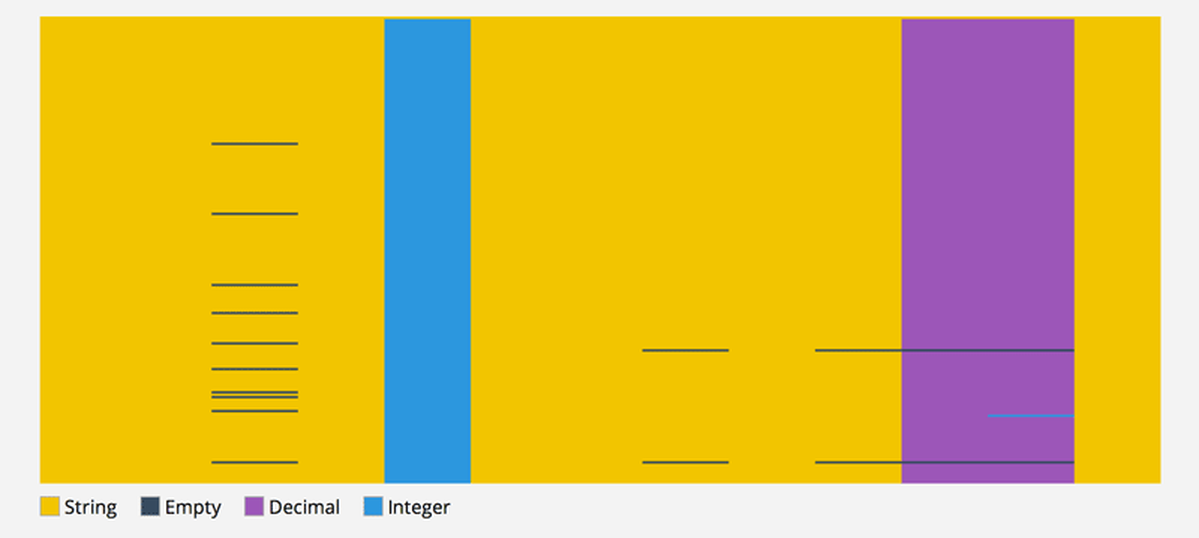
You can go to http://setosa.io/csv-fingerprint/ and paste a CSV file into the input field. Then click “generate.” You’ll then be taken to a fullscreen CSV fingerprint of your CSV file. Each rectangle represents a cell in your data file and the color of that cell represents the type of data found within it. So for example, a cell that contains the value “Colorado River” will show up yellow and a cell with the value “37.165” will show up purple. Other types are integers which show up light blue and empty values which show up dark gray. You can then click and drag around the visualization to inspect the individual values of each cell. If you don’t feel comfortable posting your data to the site, you can also run the visualization on your own computer by downloading the code from GitHub.
Powell intends to continue working on the tool, and would love to hear how you’re using it and if there are features you’d like to see added. He’s reachable via Twitter and GitHub.
Credits
-
 Erin Kissane
Editor, Source, 2012-2018.
-
Victor Powell
mapping @uber


