Features:
How 10 Newsrooms Built a Chicago Voter Guide, Together
The highly collaborative process behind our in-depth, interactive voter guide to Chicago’s historic 2019 election

(Chi.vote)
At the end of 2018, as Chicago faced a historic election with a wide-open mayoral race and all 50 city council seats on the ballot, a group of independent newsrooms decided to try something unprecedented with their election coverage: collaborate.
The Chi.vote Collective, as it came to be known, assembled an editorial partnership between 10 local news organizations: Better Government Association, Block Club Chicago, The Chicago Reporter, The Daily Line, The Triibe, Chalkbeat Chicago, City Bureau, Reform for Illinois, South Side Weekly and Univision Chicago.
The collective produced an in-depth voter guide featuring information on all 178 candidates running for office, including forums and events, campaign finance data, and curated headlines from all 53 races leading up to the Feb. 26 election. Then we did it all over again for the April 2 run-off.
Journalism partnerships are complex and powerful things. If you’re interested in the backstory on how the Chi.vote Collective joined forces to cover the 2019 municipal elections, there’s plenty to read about that.
Here, we want to delve deeply into the tech that enabled that collaboration and voter engagement. The development team had a lot of decisions to make about the best ways to facilitate collaboration between partners while informing and engaging voters. Sometimes we used the best tech for the job, other times the most expedient. We shipped updates constantly, averted catastrophes, muscled through an election night results crash, and learned a whole lot along the way.
Here’s a breakdown of how we did it:
The backbone of any modern editorial workflow involves a content management system. This goes double for collaborations, where each team has their own stack. With contributions coming in from nearly a dozen newsrooms from across the city, including contest summaries and curated articles, it made sense to have a simple web-based dashboard where users could park their submissions to the website.
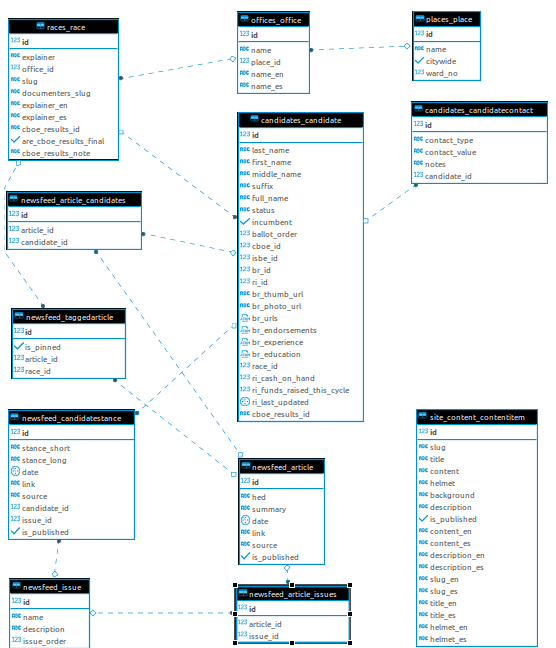
We went with Django running on a micro Ubuntu server on AWS. The ability to easily customize models made sense for our simple but bespoke app. We needed to track electoral contests, candidates, news articles, campaign finance figures, and other data. Everything is related conceptually so we naturally wanted a system built on a relational database, in this case PostgreSQL. We needed easily customizable modeling so WordPress was out. Most importantly, we were familiar with Django, from our own experiences and common use in other newsrooms, so it made sense to go with a familiar framework.

Who’s Running, Anyway?
Once we decided how we would manage all of this information, we had to go get it. We filed Freedom of Information Act requests for candidate filings with the Chicago Board of Elections and started compiling a spreadsheet of every candidate running for municipal office—all 238 of them.
We entered details about those candidates into our new database, including a flag to indicate whether they were kicked off the ballot in a subsequent legal challenge. This is a historically common tactic in Chicago politics, and this year’s election was no different: only 178 candidates made it on to the ballot.
We looked to other organizations to help fill in the details for voters. BallotReady provided basic professional resume data for candidates via live API calls, Reform for Illinois offered daily downloads of campaign finance figures, and Documenters.org provided feeds of campaign events and voter forums in iframes.
Making it Pretty
Django includes its own integrated templating system. We also took advantage of the L.A. Times Data Desk’s excellent Django Bakery to bake pages and send them to S3, effectively taking our classic web server setup offline, reducing our web-hosting costs to pennies and making our site crash-proof. (Word of caution: Django Bakery doesn’t play perfectly with the latest versions of Django and Celery.)
We connected the Django backend to a React frontend using a couple of plugins that managed file references and inlined data.
We went with a minimalist design that looks good on mobile and required minimal data transfer. The Triibe’s David Elutilo nailed it with the simple and elegant page structure, along with a dark, high-contrast color palette that manages to feature the sky blue and ruby red colors emblematic of the Chicago flag. The site reads well, leaves plenty of space to breath, and just works. It also feels great in your hand!
Clean and simple. Image by David Elutilo.
Many voters will scan for election tidbits during their commute, a few moments of downtime, or at election night watch parties. We met them where they were, which is increasingly on their phones. According to our analytics, 50% of Chi.vote pageviews came from mobile browsers.
Which ward do I live in?
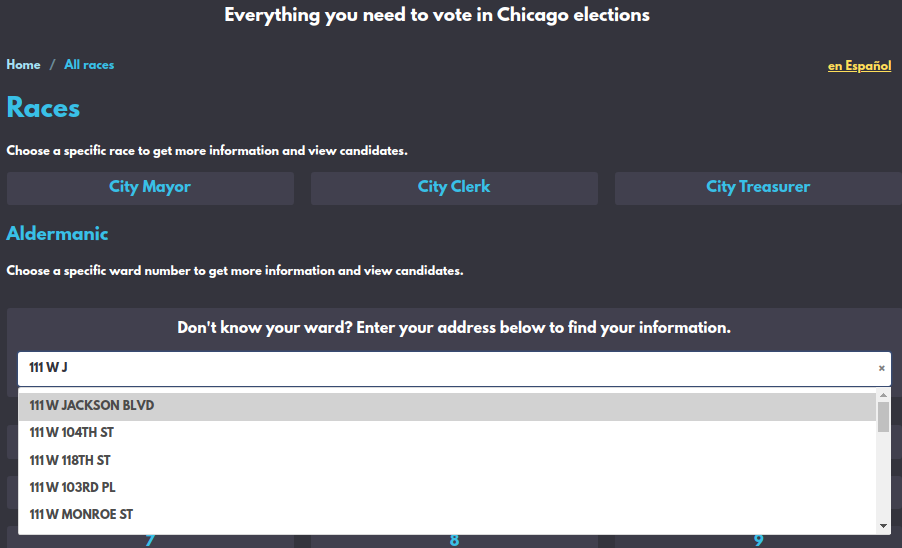
Which ward do you live in? Type your address to find out.
Some of the most critical questions to answer for voters were also the most basic: What political boundary do I live in? Who’s on the ballot? Where do I vote? In Chicago, the answers to these questions depend a lot on which of the city’s 50 wards you live in.
So we built a tool for users to look up that information. A common approach to engineering this kind of thing would be to take the point-in-polygon approach. This is a geospatial concept where, in a typical use case, a user would enter their address into a form, which sends that address to a geocoder to attempt to look up the corresponding latitude-longitude coordinate. If successful, that coordinate is then sent to a geographic information system that checks whether that point falls within any of the city’s 50 ward boundaries as represented on a two-dimensional plane.
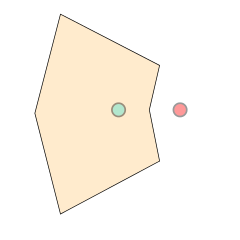
The point-in-polygon approach. We tried something different.
Wikimedia image by Adam Majewski.
Blah. That’s over-engineered and potentially imprecise. We wanted a simpler, more straightforward solution that would also perfectly account for, say, voters who lived right on the border between two wards. So we FOIA’d the city elections board for every address and its corresponding ward and voting precinct. (Have you ever noticed when you sign in to vote that the election judges have a list of every address in the precinct? That’s what we wanted: an explicit address->precinct lookup table.)
Once we acquired this lookup table, we ran a simple script to break it into a JSON file keyed off the first numerical part of the address. We then used a JavaScript autocomplete plugin that would take the user’s input from the address field and look up the corresponding list of addresses, then let the user pick their exact address from a list. It was lightning fast because all the work was done on the front end without any outside services called. And when we sent the corresponding ward and precinct back to the user, we could take the results to the bank because they came directly from the Board of Elections.
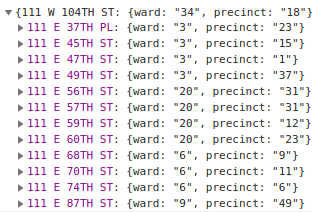
The JSON tree structure that powered our ward-lookup tool.
The Data Heist
Chi.vote’s primary purpose was to inform voters about candidates ahead of the election. To make our coverage complete, though, the collaborative took the additional responsibility of publishing live results on election night.
We had a couple of options for acquiring live results. One option was to pay for a data feed from a third-party provider, such as the Associated Press. Chi.vote didn’t have much of an operating budget, though, so we decided to scrape the results ourselves. Think of it as a heist film. But with data.
Fortunately, the city’s Board of Election posts results in a structured format that lends itself to scraping. It even posts zeroed-out “dummy data” in advance of election night so that programmers can prototype and test out their scrapers in advance. Unfortunately, the Board of Elections changed the format of its data the instant live results start piping in, which led to several tense minutes of debugging and refactoring Chi.vote’s scraper before we were able to publish results early on election night.
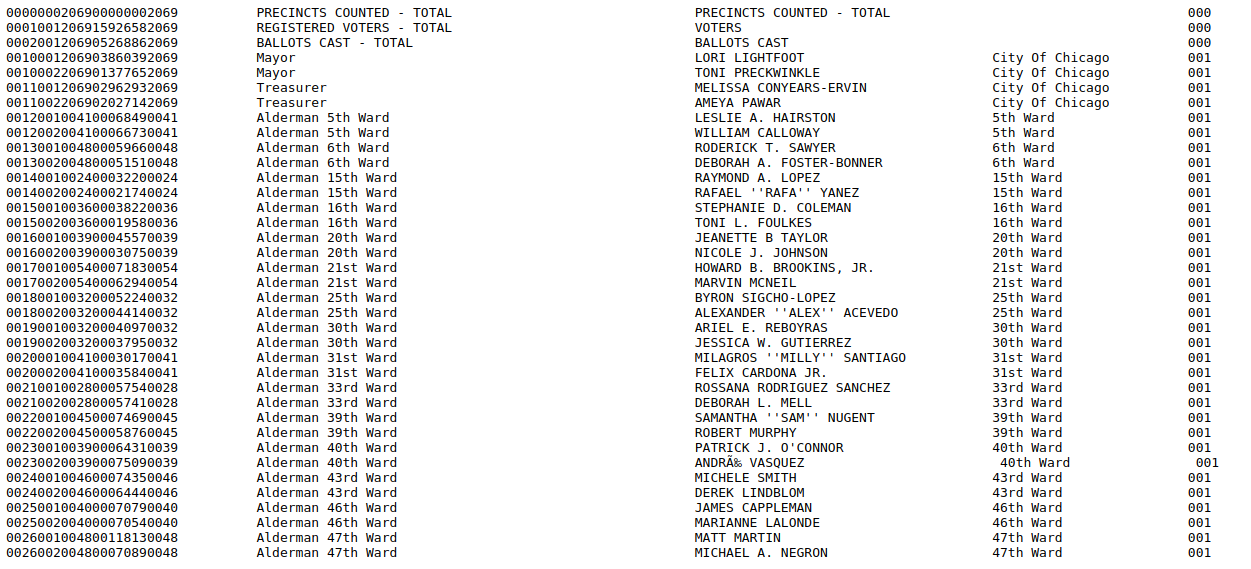
The results file we scraped, except on election night, the labels suddenly disappeared, leaving only a large block of ID numbers and results in an old-school fixed-width block format. Fortunately, we built a lookup file in advance, so we were able to quickly handle the format change and process the results by ID numbers alone.
The takeaway here is to always lobby to speak to someone in IT when you have technical questions for a government agency. The Election Board’s public affairs office claimed several times that the format of the results feed wouldn’t change from the dummy feed—and yet, sure enough, it did.
We knew better the second time around, and in preparation of the runoff election, we went around public affairs and instead staked out the waiting room at the Election Board’s IT department to talk to the people who managed the system we were scraping. We eventually convinced a high-ranking staff member to put us in touch with an IT person who verified all the technical details and gotchas that we had pretty much already surmised on our own. We took the information we learned and helped another local newsroom debug similar problems they encountered with their own scraper. (Even though this newsroom wasn’t part of the Chi.vote Collective, the operating ethos was that we’re all in this together and collaboration makes us all better.) We got burned once but learned our lesson.
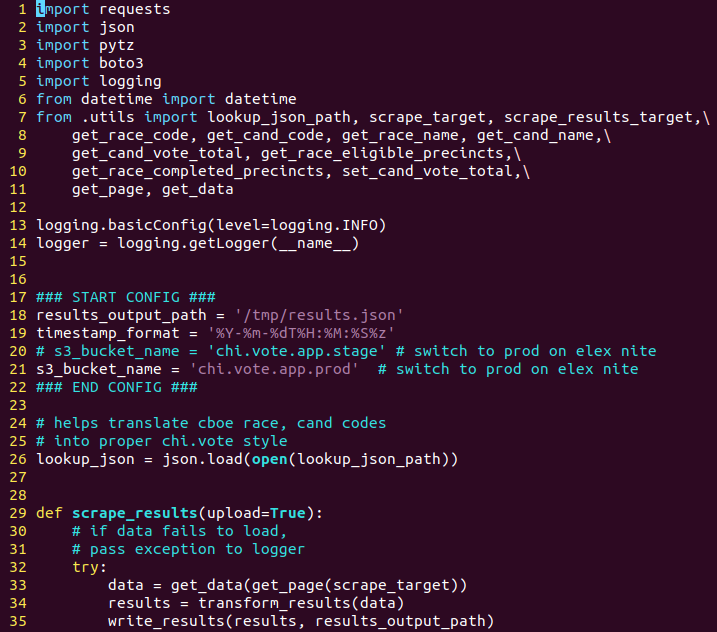
The scraper we had to bug-fix live on election night.
Collaborative Tools
We used the standard collaborative tools to keep team members in sync across multiple teams and offices: primarily Slack, Google Docs, and GitHub. Unfortunately, we didn’t have time to do a full-blown project management treatment as we were basically building the car as we drove it.
But a single project planning doc and a weekly in-person meeting/conference call was enough to keep things on track strategically. Tactically, the project’s three developers were able to work independently, check in on Slack as needed, and generally avoid merge conflicts when checking in code.
Open Source
The code behind Chi.vote is open source. We learned a lot of lessons around designing, modeling, researching, and publishing a local elections guide. Maybe journalists and technologists can use these repositories to inform their planning for future elections. We hope our code is somewhat well-documented or at least self-explanatory. But if you have questions or would like to swap war stories, please reach out to the developers from this project: David Elutilo, Patrick Judge and Matt Kiefer.
Note: Matt Kiefer and Asraa Mustufa of The Chicago Reporter led a session at SRCCON in July discussing the ins and outs of collaborative election coverage.
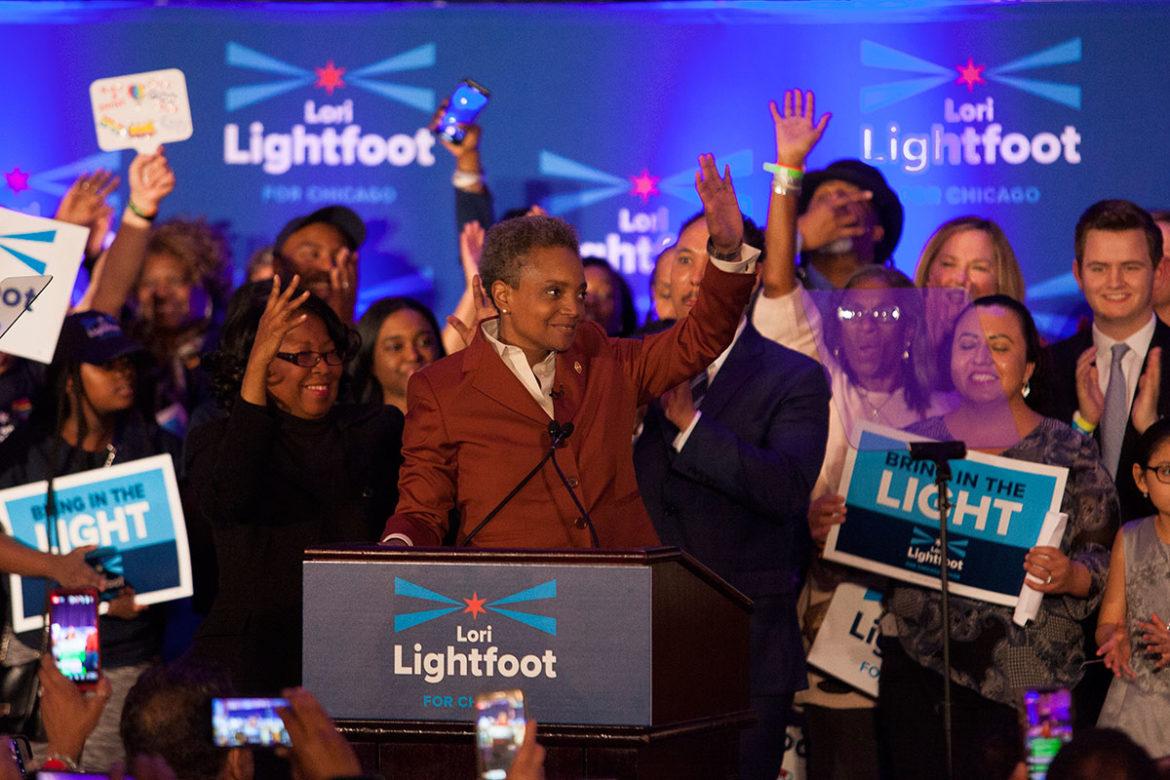
Newly elected Chicago mayor Lori Lightfoot on election night.
Chicago Reporter photo by Michelle Kanaar.
Organizations
Credits
-
 Patrick Judge
Patrick Judge is web and graphics editor for the Better Government Association (BGA). He manages development of the BGA’s CMS, and he produces graphics and interactives for stories.
-
 Matt Kiefer
Matt Kiefer is a 2020 John S. Knight Journalism Fellow at Stanford University, where he designed and prototyped tools to monitor civil and human rights. He is also a project lead for the journalism collaborative, Covid Public Info, and the creator of FOIAmail, an open source framework for automating public records requests.


