Features:
How we used Google sheets to build a fully-working newsgame prototype
The Financial Times found that spreadsheets made user testing easier, and rules structured around formulas led to simpler code

The Financial Times made its third newsgame, The Trade-Off, as part of a series of articles on companies that provide potential models for how to pursue profit with purpose.
In the game, you play as the chief executive of a technology company preparing for an initial public offering. Over four turns, which represent four years in the game, you have to choose what the company focuses on and try to keep investors and stakeholders happy.
Unlike our previous newsgames (The Uber Game, Dodging Trump’s Tariffs), The Trade-Off is primarily a resource allocation game rather than a branching narrative game. Instead of choosing between two or more options to advance the game, players are asked to see what happens as they spend resources on meeting growth targets, environmental responsibility, social responsibility, and long-term development.

A sample turn in the game: Players who prioritise environmental responsibility might not have enough resources to meet business targets, angering their investors.
This presented not only new UI challenges, but also design challenges. We needed a way to prototype game mechanics that would let us make changes easily, and test for edge cases that produced unreasonable results.
In previous choose-your-own-adventure-type games, we used Ink, the open-source scripting tool, to generate a playable prototype for testing and to gain buy-in in the newsroom. This time, we used Google sheets instead.
Why Google Sheets
We chose Google sheets because the game essentially involved the player changing numerical values, which determined what scores and narrative feedback they would see. This meant that all the functionality we needed—look-ups and basic if/then logic—existed within a spreadsheet.
Google sheets are portable and easy to share, which made user testing quick and easy. They also made remote user testing possible, with a project team distributed between New York, Hong Kong, and London.
A third advantage: A Google sheets prototype effectively separated “how the game works” from “how the game looks.” Its low fidelity made it sufficiently clear to people that we were testing game mechanics: Was it fun? Did it make sense? Did you get the feedback you were expecting? This made user testing feedback much more useful and focused.
How we structured the spreadsheet
We began with just two parts: Everything that needed to be visible to the player would exist on one worksheet, and everything else would be on another. We wanted to give testers simple instructions and not ask them to flip between different worksheets. We also wanted to simulate the eventual experience players would have, and not show all the inner workings upfront.
This simple division soon became insufficient. It was feasible to keep the game on a single sheet (with the player “progressing” through the game by scrolling down), but the data on the back end soon became too big to navigate and change easily. We split it into separate sheets holding data for each turn, another sheet for special events, and a final sheet for the ending.
The final change to the structure of the spreadsheet came when reporters offered lots of suggestions for improving the text as the game evolved. They particularly enjoyed, for example, telling players who prioritized business returns that “Milton Friedman would be proud of you!” They needed an easy way to edit text and data sheets, which, combined with numerical data and logic, was too fiddly and complex. A new text sheet stored all the narrative in one place.
The game logic was relatively simple, using IF, IFS and VLOOKUP functions to pull in the right text response or score change, giving the player dynamic feedback to their actions.

We also used basic color-coding and formatting options to guide players on how to play the game in Excel.
What we got out of the user testing
User testing in this way allowed us to create a playable prototype very quickly—essentially within a week. It was also modular. We were able to test how a single turn worked, and made sure that was fun and made sense, before building out all four turns. We tested gameplay again before adding special events between turns, like what to do when employees protest against your company taking on a lucrative but controversial government contract, or whether to fire the in-house barista during a downturn.
By having a playable prototype, we were also able to get buy-in (or at least gauge excitement) much more quickly. Editors not directly involved in the project understood the game and what it was trying to achieve once they played it.
And we were able to make multiple rounds of changes (for example, do we call it ‘Long term development’ or ‘R&D’? Or maybe ‘long-termism?’) when it was cheap and quick to do so. This was especially helpful in making sure that choices felt impactful, the whole game felt cohesive, and that we avoided unrealistic edge cases.
User testing was conducted with a diverse group of participants as our intention was to attract new readers who might not normally read the FT.
After the game went live, we were able to verify with analytics that players’ scores for investor and stakeholder happiness were spread out over a relatively wide range—this confirmed that we didn’t accidentally ‘rig’ the game towards a narrow set of outcomes. And the game proved a compelling experience: ⅔ of players who started the game finished it, and ¼ of those replayed the game.

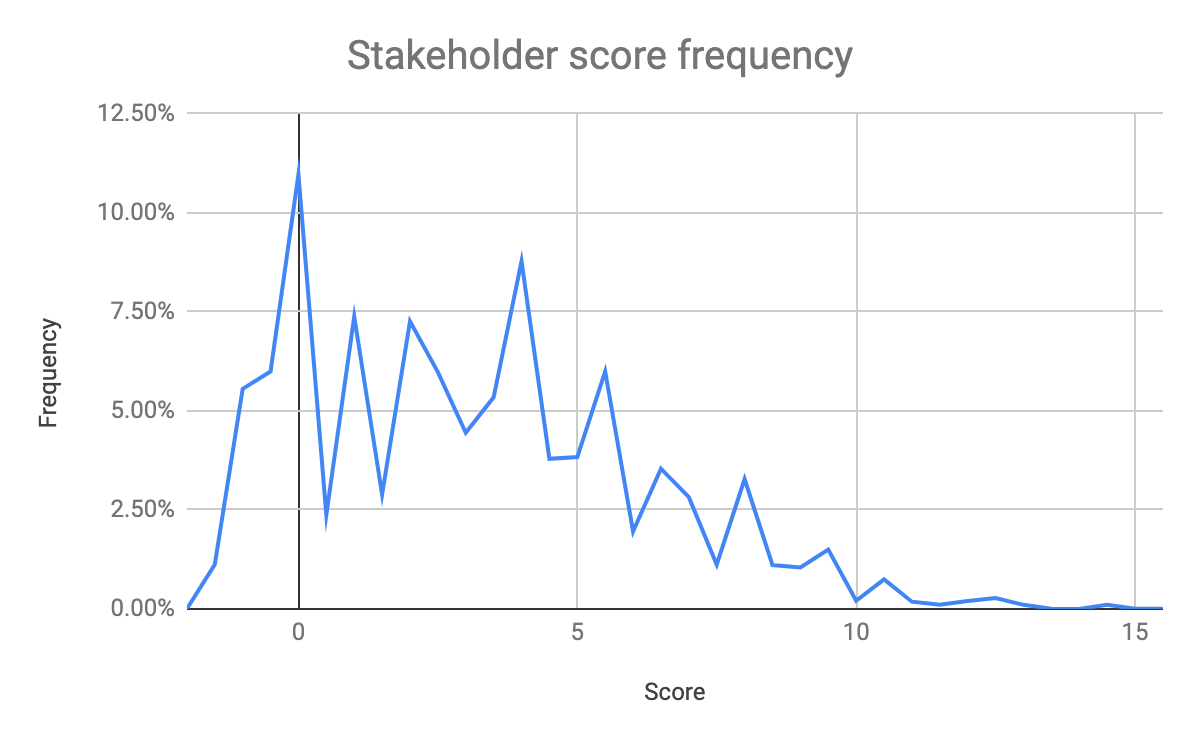
Players were more likely to fail the game after losing support of their stakeholders than they were shareholders.
How Google Sheets made development easier
Codifying the rules of the game in a structured way and at such an early stage made work easier for our developers. From the spreadsheets alone and without any earlier involvement with the design of the game, they were able to understand how each of the game’s systems worked. The relative simplicity of spreadsheet formulas meant that game logic was simple to code. In three days, our team managed to turn the spreadsheets into a working web-based version. Our in-house illustrator, James Ferguson, and data visualisation journalist Fan Fei also worked quickly to create friendly, clear graphics that brought the page to life.
Bertha, our in-house tool that turns Google Sheets into live data endpoints, also made it easier to update the game: Rather than having to export the data each time we made a change, we just had to republish the spreadsheet. This facilitated quick changes to game logic and difficulty. We could update the spreadsheet prototype, test with users, and have a new version working on the web in minutes.
Lessons learned
While spreadsheet prototyping had many advantages, there were also some limitations. We mostly still had to look for outlier and edge cases manually and in an unsystematic way. We probably could have used code to simulate thousands of runthroughs to find outliers more easily if we had set aside time for that level of testing.
Some hurdles that could easily be overcome by UI solutions (like using animation to make feedback more prominent) tripped people up when they were interacting with the Google Sheets version. The reverse was also true: Some things were easy to do in the spreadsheet (like go back to a previous turn) that we didn’t realize was a feature people expected or wanted until we built design wireframes.
Overall, however, we think Google sheets gave us a really good way to quickly generate a playable, shareable prototype, and would be a useful tool for anyone designing this kind of newsgame or interactive news app.
The Financial Times team that developed The Trade-Off:
Game design: Robin Kwong
Text and scenarios: Andrew Hill, Andrew Edgecliffe-Johnson, Robin Kwong
Design and development: Fan Fei, Cale Tilford, Jane Pong, Claire Manibog
Project management: Robin Kwong, Claire Manibog
Illustrations: James Ferguson and Fan Fei
Organizations
Credits
-
 Robin Kwong
Robin Kwong is the Newsroom Innovation Chief for The Wall Street Journal, where he leads a team of developers and designers to prototype new formats, features, and tools. He was previously Head of Digital Delivery at the Financial Times.
-
Cale Tilford


