Features:
Let research apps, MVC JavaScript, and APIs work for you
The Center for Investigative Reporting team tells how
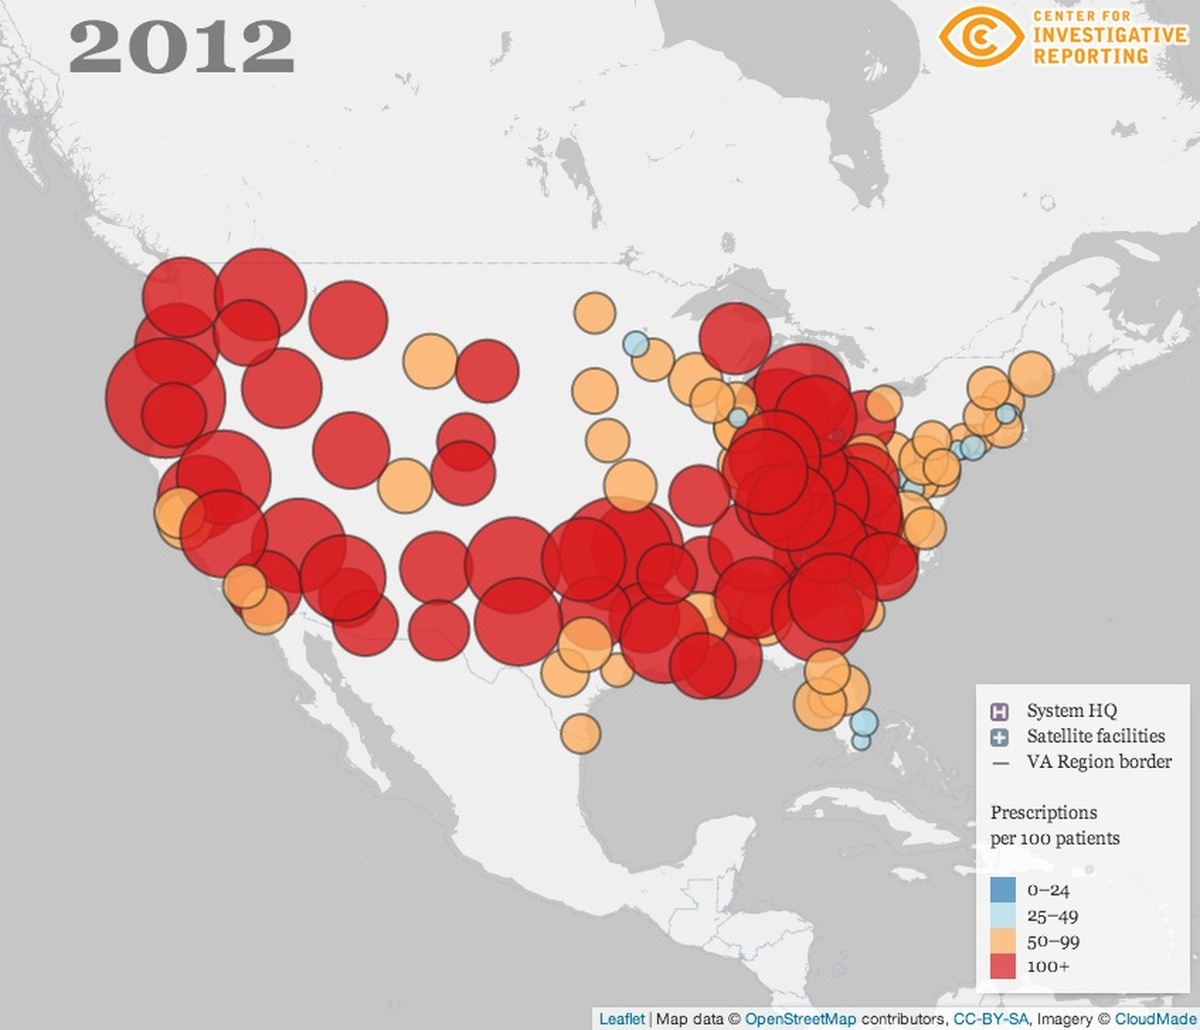
Opiate prescriptions based on Department of Veteran Affairs’ data. (Image: CIR website)
[Cross-posted to the CIR Labs blog.]
When a large, national data set showing a massive increase in the Department of Veterans Affairs’ opiate prescription rates landed on our desks in August, we asked ourselves the same question that normally begins our data app development process: What tools and techniques can we employ to best showcase this material? We wound up leveraging approaches we’ve honed over the past few years while incorporating some new ones. We even learned some lessons along the way, which might be helpful for your newsroom to consider when crunching big chunks of data.
This post is broken into two parts. First, we’ll discuss how building “research applications” is a great approach to developing intelligent news products quickly. Second, we’ll discuss the tools we used to build this particular app and how we used a JavaScript MVC framework to our advantage.
We hope that by using some of the techniques we describe below other news applications developers can build apps that use sophisticated (and free!) tools at record speeds and create engaging news products.
Research Apps
Data comes to our newsroom in many different ways. Often, it’s in response to reporters filing public record requests, but we also scrape websites and have our hooks into a number of continually updated data streams.
So, once we have the data, how do we make .dbf, .xls, .csv, .pdf, and .json files play together? Our answer is to write load scripts that clean up the various data sets we get and shove all the data into a framework.
This is how we start our research apps. A research app is an application created to “interview” data and find out the answers to the questions we have. We typically use Django and PostgreSQL for these things, but a research app isn’t stack-specific. By throwing our data into a database and framework early, we get a head start on modeling the data. It also saves a ton of time should the data or process of gathering it change. Specifically with Django, we can use the ORM to manage and weave all our data sources together.
It also allows us to utilize many powerful Python tools, such as FuzzyWuzzy for name matching and pandas for statistical analysis and geo queries. Some examples: Under the tutelage of Chase Davis, our former technology director, we used a spatial clustering algorithm to look for clusters of community college offices in California. We also used a machine learning algorithm to pick out the drug-related press releases from U.S. Customs and Border Protection.
Research apps allow us to do powerful forms of analysis, all in one reproducible bundle. For longer-term projects, we can publish very basic webpages displaying the in-progress analysis with maps, charts, and tables that the whole team can work from. All the data displayed is current and easy to update. That keeps out-of-date spreadsheets from littering inboxes and file systems. And if a reporter has a specific query to run, we write a model method: instantly documented and easy to tweak. That keeps unintelligible SQL queries from littering analysts’ notes.
APIs Rule Everything Around Me
Since much of what we do has a lot of front-end interactivity (mapping, sliders, etc.), and because we often get requests for slices of our national data sets, we’ve found it helpful to run our apps off their own APIs. This approach also helps make our data more open and accessible for folks who want to do their own analysis, localization, and reporting.
Our tool of choice is Django Tastypie, as it’s easy to set up and reasonably well documented. It outputs JSON (among other formats), which is a great way to represent data and makes building JavaScript-based interactives a breeze. Come publish time, our data-driven interactive, as well as the data we used to build it, can launch simultaneously.
We’ve used this approach with great success in our ongoing coverage of wait times for veterans applying for VA benefits. By opening up the data and encouraging media partners across the country to localize it for their areas, we’ve enabled more than 15 media outlets to create original, local stories from our work, with dozens more citing the information in their reporting. Highlighted circles on our interactive map show just where our media partners have paired the numbers with local veterans’ experiences.
We also used this approach with our U.S.-Mexico border drug seizure API. It’s incredibly rich, with data on more than 130,000 individual seizures of marijuana, cocaine, methamphetamine, and heroin by U.S. Customs and Border Protection and the U.S. Border Patrol. If you’re interested in that data, please dig in or get in touch.
We went a step further with the opiate prescription data, creating a step-by-step localization guide along with the app to help folks understand the numbers. And we’re already seeing results.
Building the Front End
For our initial work on this project, we used the usual suspects: Handlebars.js for templates, jQuery for DOM manipulation and AJAX, Leaflet for mapping, and Bootstrap 3 for the CSS framework. The early version of this app made a server call to the API to retrieve the JSON and sent the response to Handlebars to create the template. We spent about a month on it, and we were pretty close to wrapping it up, but we were bothered by the lack of shareability.
For example, how would a reader use social media or email to share information specifically about her local VA system? This is almost always a feature we want. We’ve previously built in sharing for individual slices of a larger data set, but it involved a lot of custom code to read URL GET parameters, which then pulled some levers in the background. Furthermore, managing a bunch of JavaScript objects in general is a tough task, and the code was growing harder and harder to read.
Developers and reporters alike have dealt with 11th-hour changes to their products. Sometimes it’s a bug fix, sometimes it’s a request from above and sometimes it’s finding a better angle or source for a story. In our case, we realized that by refactoring the app we could kill a lot of birds with one stone.
Ember and Django
In our previous application on the VA’s disability benefits backlog, we used Backbone.js to handle the locations of VA processing centers. In the interest of exploring new territory, we decided to build with Ember.js.
Ember.js is pretty bleeding edge. In fact, its API only went 1.0 (that is, they locked API changes) while we were building the VA opiates interactive. Despite being brand-new, Ember.js proved useful for structuring applications around URLs and provided great features for managing application state.
NOTE: It takes some work to get Ember and Django to play nicely, but luckily many great developers have already done the hard work. Check the bottom of this post for the versions/tools we used to make Ember work with Django.
In our final product, as a user clicks around the application, the template and map will adjust without actually reloading the entire page. Edit any URL, e.g., /region/14 to /region/13, and the app will move to that model, update the model’s template and fetch the corresponding Leaflet information immediately. Press “back” in the browser and the same thing will happen. That is Ember.js at work. Ember is watching the state of the model that is displayed. This all starts with Ember Routes:
App.Router.map(function () {
    // truncated output
    this.resource('region', {path: 'region/:region_id'});
});
Ember sees this region route and implicitly creates a RegionController object in memory that looks for our Region model and provides the correct data for the route. Controllers in Ember move data between the model and the route. If your JSON is formatted the way Ember expects it to be, you won’t even need to explicitly create a model. The special :region_id syntax tells Ember to do an AJAX call to the API to get the id property of the model. For example, going to va-opiates.apps.cironline.org/#/region/13 in the browser fetches va-opiates.apps.cironline.org/api/v1/region/13 from the API and returns the data to the app.
Ember Views allows you to control what happens when someone interacts with the page, e.g., clicking on a button. The app uses Ember Views all over the place to adjust content based on user interaction.
Ember.js also lets you observe changes to the application state. For example, when a user goes from one region to another, we make sure to run a function to rebuild the map based on the new model.
App.RegionMapView = Ember.View.extend({
        // truncated code
    modelChanged: function() {
        var region_id = this.get('controller').get('id');
        Opiates.Region.buildMap(region_id);
    }.observes('controller.model')
});
Here, Ember observes a model and runs the code in the modelChanged() function when the model is changed.
It’s worth noting that while Ember is great at moving content around a Web page, it doesn’t handle crazy-nested JSON very well. Considering that the data that drives news apps tends to be pretty nested, it’s worth keeping your API as simple as possible for Ember. Otherwise, you’ll have to mess around to make things work. Make sure you discuss your API first – before heading deep into Ember.
Lessons Learned
The flexibility available to developers today is astounding, and we at CIR are working hard to make our development process as smooth and simple as possible. In real time, we can load data into a database, model it with a framework and have a live JSON feed of the data done – all before dinner. Progress!
While the front-end code was fun to write, building the research application first was crucial in the development of this application. By having a live API to work with from the beginning, we saw firsthand how someone else might approach building an application with our data. Furthermore, we were able to refine the API itself based on what we needed. Rolling thunder!
Code Appendix
The code repos used in this project:
Credits
-
Agustin Armendariz
Нет ничего более изобретательного, чем природа.
-
 Michael Corey
Michael Corey is a senior news applications developer at Reveal. He specializes in mapping, science, front-end Web development and interface design. Keep Reveal weird.
-
 Aaron Williams
Aaron Williams is a data journalist, analyst, and visualization expert tackling inequity in data and design at scale. He’s currently a senior visualization engineer in Netflix’s Data Science and Engineering group and previously spent a decade as a data and graphics reporter—most recently at the Washington Post.


