Features:
How We Made a Story That Changes Based on Your Birth Year
A Q&A about Vox’s recent interactive on the superiority of today’s teens
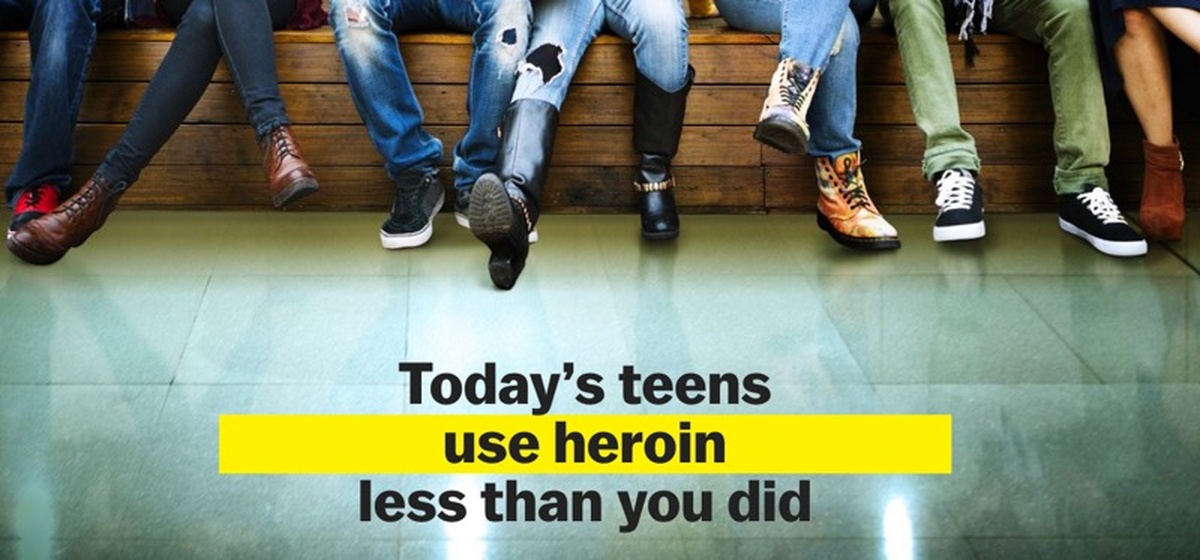
Teens are probably doing better than you were at their age, and this story tells you exactly how.
Vox’s recent interactive on teen health asks the user for their birth year and then, based on that, changes the text of the story. We thought it was a fascinatingly personal way to contextualize CDC health data, leveraging readers’ innate curiosity about how they stack up. We talked to developer Soo Oh about the process of making it, and, side bonus, how she adopted a rescue dog just before publishing it.—Ed.
Building a Concept
Q. The whole piece is really engaging and interesting to play around with, especially given all that dense data. How did you all come up with the concept?
Sarah Kliff, the writer of the piece, has been following health and CDC data for a really long time because she’s a healthcare reporter. She had this idea that it’d be really cool if we could customize a story based on the years of data we had. Because there was so much data, she thought it would be great to show people how they compare, since that’s what people care about, in a way. Everyone has an opinion on teenagers. Or, even if they’re neutral, they think they know something about teenagers.
Q. What’s the main ingredient that made this piece come together?
I think our team has particularly good communication across the board. This was a really large collaboration, both in person and remotely. Before this came out, I was working that whole week from home, because I got a new dog.
[Pause while we discuss Soo’s amazing, newly adopted dog.]
Q: So… I’m probably going to have some follow-up questions about the dog. But first I guess I can ask you more about teenagers. What can you tell us about working with this data set? How did you choose what data to focus on?
It really helps to have a reporter who has been reporting on this for a while, so they can say, “Okay, every year we can see these declines.” [CDC data] is reported every two years, and so on a year to year basis, it’s not very easy to see those declines. Sarah Kliff ended up going through it manually and picking out the stats that were most interesting.
We chose to focus on categories that didn’t change from the early 1990s. Today’s teens probably watch more Netflix, for example. Mobile phone usage is definitely up, but we wouldn’t have data stretching back to 1991 for it. Same with vaping, they’re probably just starting to get statistics on it. They only just started collecting stats on long-acting reversible contraception recently, but that’s also become a really popular option for teenagers.
Still, there’s a lot of stuff that kids today can do that you could do twenty or thirty years ago, including drinking, doing drugs, having sex. They just do a lot less of it.
…One of the sad parts of the story (and we kept kind of joking about it) is that if you’re born before 1972, you can’t do the comparison because we don’t have that data. We were wondering, what about people who are over 40 and cannot use this tool? In the end, we thought it could be interesting anyway. It’s not like adults don’t know any teenagers, whether it’s their own children or other family members.
Design, Code, Math

The slider: more fun than a dropdown.
Q. How did you decide on this UI?
Originally we had that year slider as a dropdown instead, but we were afraid people were going to scroll past it. We wanted to make it more playful. We want to make sure that we don’t put all this work into something, and then it’s not fun enough for people to actually select. It was really awesome to see that people were playing around with the slider. I attached some analytics to it… I think people wanted to see the decline happen over the years. There were more interactions than page views–so perhaps a lot of people changed the year several times to see the difference. Which is great. The whole point of switching the design [to a slider] was getting to people to interact. Sliders are just kind of fun to play with.
Luckily I had already used a particular slider library before so it was not difficult for me to quickly redesign that, two days before publication.
We actually had the headers styled the day before, too. (Javier Zarracina, the graphics editor at Vox.com, helped design the graphic headers.)
I used to work at a paper, and no shade on newspapers at all, but stories are often tied to print deadlines. And there’s so much lead-up time because everything had to be coordinated in that way. The interesting thing about working at a site without a print deadline is that if it’s not ready by a certain day you can just push it. It’s like: we’ve already spent so much time on it, let’s make sure it’s great.
Q. Can you tell us more about the tech side of things?
We used Backbone.js to set up various routers for those year URLs, so you could share whichever year that you were born in. It’s all hooked up so that if you make your selection, or go to that URL with the year preselected, it just changes all the dynamic text on the page. There’s a dynamic paragraph set up, but also there are dynamic sentences strewn throughout. We also highlight the year that you are a teenager in our charts so you can see where there’s an uptick or a downtick.
We used D3 for the charts. We have it set up so that all the statistics will change based on what you select as a year. Also we have default stuff in case people scroll past that year selector and decide not to select a year. Hopefully it’s not because their birth year was not represented!
The Challenges of a Multistory
Q. What were some of your biggest challenges, as this came together?
To be honest, hooking up all that router stuff is simple. The thing that was of course nerve-wracking was, “Did I do the math right? Did I set up the equations right? Did I make sure that it’s a percent change?” That is stuff you have to double check and feel comfortable about.
The year that you’re 15 or 16 is what we based the data on, except for the very edges. So that would be if you were a teenager now, or if you were 19 in 1991, which would be a birth year of 1972. Technically the CDC data is a survey of high school students, which means you could really be anywhere between 13 and 19, depending on when in the year you were born, although I think in general people think high school students are between 14 and 18.
In terms of coding, the things that were hard were also making sure that when you did change stuff, that it still read grammatically correctly, and text referred to the right things. Sometimes we had to change default sentences completely to make them make sense. Something like, “Today’s teenagers do this” versus two decades ago would have to be changed if you are a teenager reading this. You would have to switch it up and give them context. If any teenagers picked their birth year, they would be given a comparison from twenty years ago. Some of the stuff that was originally written didn’t really fit in these cases and we had to rewrite them to make sure the paragraphs still flowed. We didn’t want to give you a list of statistics—it had to feel like a real story.
For me, the challenge was getting the story right no matter what year you selected.
Q. How do you approach QA on a piece like this, where there are dozens of possible permutations and so many things that change?
You could QA for every year but it would take a long, long time. I just QAed for some years, and because all of my code was connected, I felt really confident about the numbers that ended up being generated and calculated on the fly.
I did have to go through and check three different stories, in a way. There’s a big block of stuff that’s generated—a couple sentences and three bullet points right after the year. I gave our copy editor three versions: the default view if you don’t select a year; a version if you’re old enough to have a comparison, 1972 to 1996; and a version if you are a teenager now, 1997 and after.
Q. Tell us more about that equation.
It’s just percent change. Someone asked me in the News Nerdery Slack if you can do percent changes even if the number of survey respondents isn’t the same every year. Yes—this is a statistically significant survey, so you can do percent changes.
On a side note, it was really great going to the News Nerdery Slack and asking for bug reports. Someone immediately was like, “The dropdowns don’t seem to work on Firefox.” It was really cool getting that feedback.
One Big Collaboration
Q. If you had to name one, bottom-line sort of thing that made this piece successful, what would you say?
We had to do a lot of back and forth; this was a really close collaboration between the writer and developers. I think that really helped. Also: Sarah Kliff is technically our editor but she is also a healthcare reporter, and she sits right by me. Having that constant communication with the writer and the other developer, Sarah Frostenson–getting that constant ability to make edits on the fly and also telling the writer, “you can’t do this because of this….” At some other news organizations, I think there’s more of a barrier. Working directly with the writer or writing it yourself is one of the only ways this project could’ve been done. If there are too many layers, it can be difficult to work on something where the text is changing.
Q. What else was totally vital to making this happen?
Vox Media actually has design reviews—I got this checked out by all the designers on the editorial products team, who aren’t affiliated with any of the verticals. It was really great to get that kind of feedback and make changes based on what they said. I showed them most of this story on Monday—and did not have the slider in place by then. But they agreed we did need something slightly more playful. (We switched it from a dropdown to buttons on that feedback, but then when we looked at the buttons they were not that fun either.)
The designers on the product team are also available through throughout the week informally. It’s really great. Even if we have a formal design review on Mondays, I can drop into a Slack group and ask what people think. We tried out various ways to switch out the text for the headlines. These are people who are designer-designers. That’s what they do. I think we all have a decent visual sense, but it’s so great to have design experts looking at our stuff and letting us know what would feel better, how to improve the UI, stuff like that.
I don’t know if a lot of editorial teams have as much access to people who are on the product team and basically just experts. I do feel like the integration with the product team is super helpful in pushing out stories like this.
Kelsey Scherer and Jason Santa Maria are designers on the Vox product team, and I found their feedback to be really helpful.
We concluded this Q&A by talking about dogs for another 30 minutes, and I adopted a dog from a shelter in Chicago two days later. Someday, our dogs will meet. Thanks for talking and sharing your wisdom on all things, Soo!
People
Organizations
Credits
-
 Lindsay Muscato
Editor of Source from 2015-2020
-
 Soo Oh
Soo Oh is the Data Editor at Reveal from The Center for Investigative Reporting. She has previously reported data stories, coded interactive visuals, and built internal tools at the Wall Street Journal, Vox.com, the Los Angeles Times, and The Chronicle of Higher Education. In 2018, she was a John S. Knight Fellow at Stanford University, where she researched how to better manage and support journalists with technical skills.


