Features:
Introducing Wherewolf
A serverless boundary service from WNYC

As part of the OpenNews post-election Code Convening, we put the finishing touches on Wherewolf, a JavaScript library that lets you run a boundary service in a browser.
What’s a Boundary Service?
The term “boundary service” comes from the Trib Apps Boundary Service, the granddaddy of them all. It’s a means of comparing a geographic point against a set of districts and finding which district that point is in.
This sort of scenario comes up when news apps try to provide a personalized view into data. In order to show a user the slice of information that matters to them, you need to know which bin they fall into.
As an example, consider WNYC’s SchoolBook: we get someone’s school district based on a home address so that we can show them only the schools a child would actually be eligible for. Going from “I live at 123 Broadway” to “That’s in School District 2” is the step Wherewolf is designed to solve.
Why Wherewolf?
There are already some great resources out there for running your own boundary service, like django-boundaryservice, based off the Trib Apps version. So why make our own?
The downside of the existing approach is that it requires you to set up a server for the heavy lifting. The installation and configuration isn’t trivial, and you need enough savvy and patience for the hiccups that inevitably occur when playing sysadmin. We definitely don’t have that patience. We hate running servers. And servers are yet another thing that can break. The last thing we want to worry about on election night is the possibility that our boundary service will crash.
We wanted a way to have the functionality of a boundary service while avoiding the stress of managing servers. That’s when the full moon came out.
How Does It Work?
Using Wherewolf requires three things:
- A set of districts, as GeoJSON or TopoJSON
- A latitude and longitude
- An eagerness to make werewolf puns
Here’s an example snippet of how it works:
 //Summon a wherewolf
 var wolf = Wherewolf();

 //Add your districts
 wolf.add("Judicial Districts",myGeoJSON)

 //results will contain the properties
 //of the matching judicial district
 var results = wolf.find([longitude,latitude]);
There are a few other options and nuances, but those three lines of code are the core use case of Wherewolf. As long as myGeoJSON is an existing GeoJSON object of your districts, that snippet is enough. For details on some of the extra options, read the docs.
OK, but how does Wherewolf really work? How does it know which district the point is in? If you’re curious, skip down to Fun with math.
Wherewolf for Research
Wherewolf can also be used for research and analysis, as a Node module:
npm install wherewolf
For example, if you have a list of crime reports and you want to categorize them by what city council district each crime is in, Wherewolf can help. Feed it some GeoJSON or TopoJSON of the city council districts and then call .find() on each location the same way you would in a browser.
Performance
One of the concerns going into Wherewolf was: will it be fast enough? Can we rely on a user’s browser to do this heavy lifting instead of a beefy server we control? There are two performance issues to wrestle with: file size and calculation speed.
File size is an issue because in order to load in your districts as GeoJSON or TopoJSON, you need to load that data from a file first. This is perhaps the one significant downside to the in-browser approach. But in reality, you can get these files down pretty small. A gzipped TopoJSON file of all 3000+ counties in the US is only 78k, about as big as one medium-res JPG image. And there are a few strategies to mitigate any delay for the user that really make this a non-issue (see the Performance and Getting Fancy sections of the docs for details).
Calculation speed is an issue because the browser has to do a bunch of math (see below) to locate a given point. But it turns out computers are really good at math! We stress tested Wherewolf with an extreme example by locating thousands of random points against sets of thousands of districts. In most cases, it took about 0.07 milliseconds (that’s 70 microseconds). The slowest case was an old phone running Android 2.3.4, which averaged 8.2 milliseconds. Yeah, that seems fast enough.
Fun with Math

The Data News whiteboard, mid-Wherewolf
How does Wherewolf actually determine where a point lies?
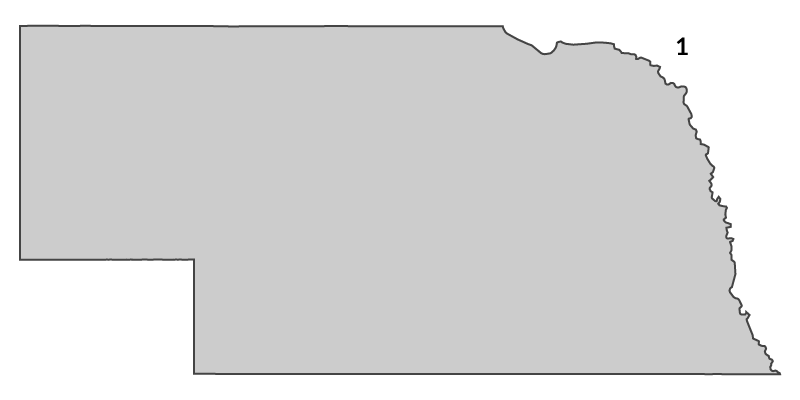
Geographic districts are generally made up of polygons. Nebraska is one polygon.
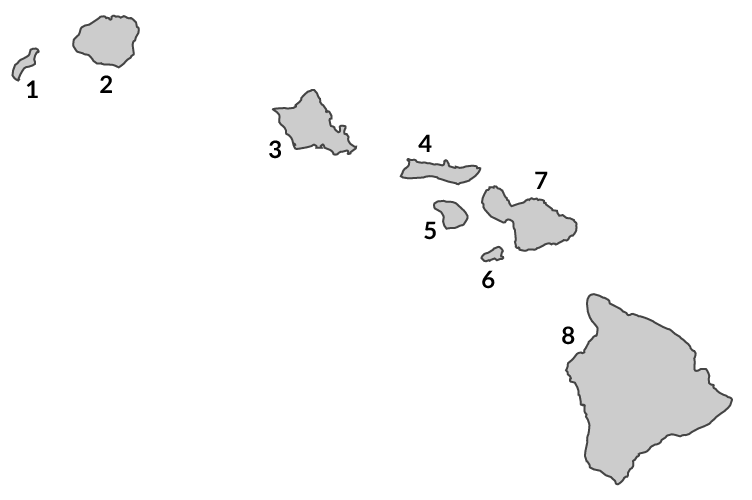
The state of Hawaii is 8 polygons (one per island, give or take a few stray volcanic rocks).
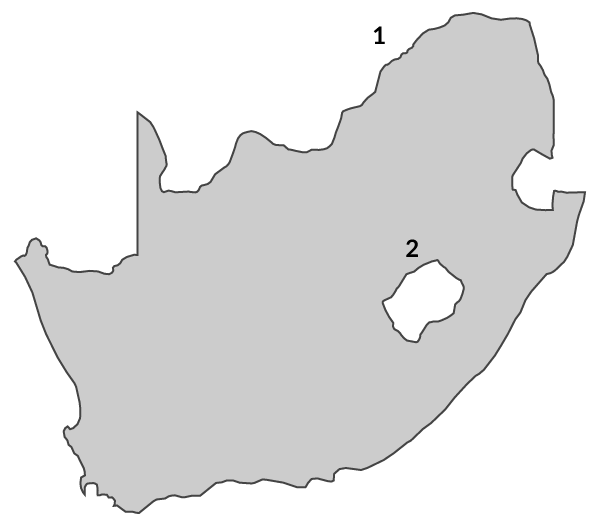
Each polygon can also have holes in it. South Africa is a polygon with a hole polygon cut out of it (the nation of Lesotho).
So, once we recognize that we are always dealing with a list of polygons, the process of checking looks something like this, in pseudocode:
 For each district...
   For each polygon in the district...
     If the point is in this polygon...
       And it is NOT in any of the holes in this polygon...
         It's inside this district. We're done.
The relevant section of the Wherewolf code is not actually that much longer.
So the core problem we now have to solve is: how do we know whether a point is inside a particular polygon? Fortunately, the point-in-polygon problem has been solved many times over. Stand back, we’re going to try geometry.
The first way you can determine whether a point is inside a polygon is through a technique known as raycasting. We’ll draw a line out from the point in one direction forever (it doesn’t matter which direction), and then we’ll count how many times that intersects with the polygon. The number of intersections is called the crossing number. If it’s an even number, the point is outside the polygon. If it’s an odd number, the point is inside.
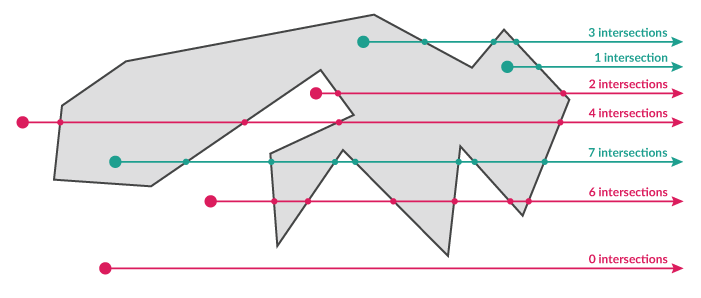
This almost seems too easy, but consider that for any point outside the polygon, that ray will either a) never touch the polygon (0 intersections) or b) for every time it enters the polygon, it will have to exit later (an even number of crossings). The only way to have an exit without an entrance is to have started inside the polygon.
Try this interactive demo of Wherewolf geometry. Click anywhere around this map of Tennessee and it will go through each congressional district, counting the intersections for that polygon, until it finds one with an odd number:
In case you aren’t convinced that this will work with any shape, here’s a version with the craggy state of Maryland. Click anywhere to compute that point’s crossing number:
Wherewolf uses a version of this algorithm, described in detail here and first implemented in JavaScript by substack, that properly handles edge cases like a ray overlapping with an entire line segment.
Just for fun, let’s talk about another algorithm: the winding number. In this case, we want to count how many times a polygon winds around the point. The standard method for this involves trigonometry and would be much slower to compute, but we can turn this into another sort of raycasting problem with some cleverness, described in detail here.
We draw a positive x-axis out from the point, and we want to look at the segments that cross this axis. But unlike the crossing number, where we care about the number of intersections, this time we care about the direction of the crossings, following the border around in one direction (either clockwise or counter-clockwise).
The winding number starts at 0 and then we add 1 for each segment that crosses that x axis going up, and subtract 1 for each segment that crosses going down.
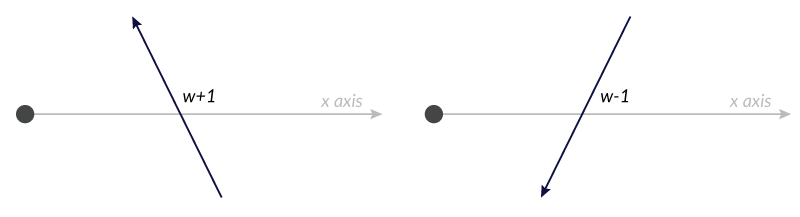
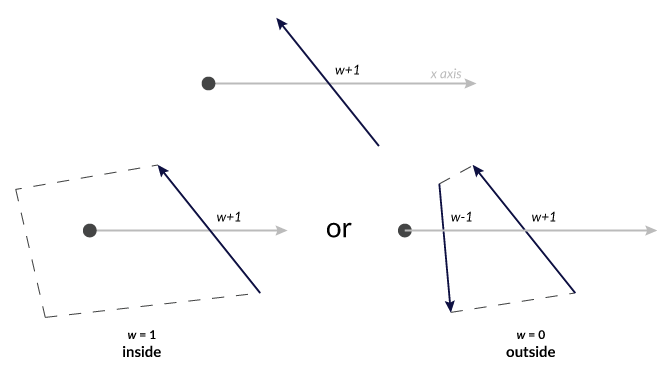
If the winding number is anything other than 0, we know the point is inside.
The key here is that if a segment crosses the the positive x axis, a future segment will eventually have to close the loop by crossing again in the other direction. If the polygon winds AROUND the point and crosses on the left side, that will put the point inside. If it crosses to the right of the point, it will cancel out the 1 you added by subtracting 1, bringing the winding number back to 0.
Here’s an interactive version. Click anywhere to compute the winding number for that point:
One theoretical advantage of the winding number algorithm is that it works even if the polygon overlaps with itself, but hopefully your city council districts don’t do that. Ultimately we stuck with substack’s crossing number algorithm because it’s proven, used by others, and passed every edge case we threw at it. As far as we know, nobody else has implemented this exact winding number variation in JavaScript before, so we opted not to fix what wasn’t broken with something unproven. (For the curious, our implementation is available in the Wherewolf codebase).
Appendix: Rejected Name Ideas
Whereabouts, Borderline, Lodestar, Line Judge, DMZ, Anaximander, Jodeci, Border Patrol, Department of the Interior, PIP-py LatLngStocking, Cadastral, Seward’s Folly, Metternich, Liminal, Terminalia, Bearings, Rebounder, Rodman, Search Party
Credits
-
Noah Veltman
Noah Veltman is a developer and datanaut for the WNYC Data News team. He builds interactive graphics, maps, and data-driven news apps, and spends a lot of time spelunking in messy spreadsheets. Prior to WNYC, he was a Knight-Mozilla OpenNews Fellow on the BBC Visual Journalism team in London. Some of his other projects can be found here.
-
Jenny Ye
Producer, WNYC @datanews. basketball and ethnic studies junkie.


