Features:
The Lobbyist Registration Meter
Sunlight Labs Director Tom Lee talks lobbyist data and Raspberry Pi
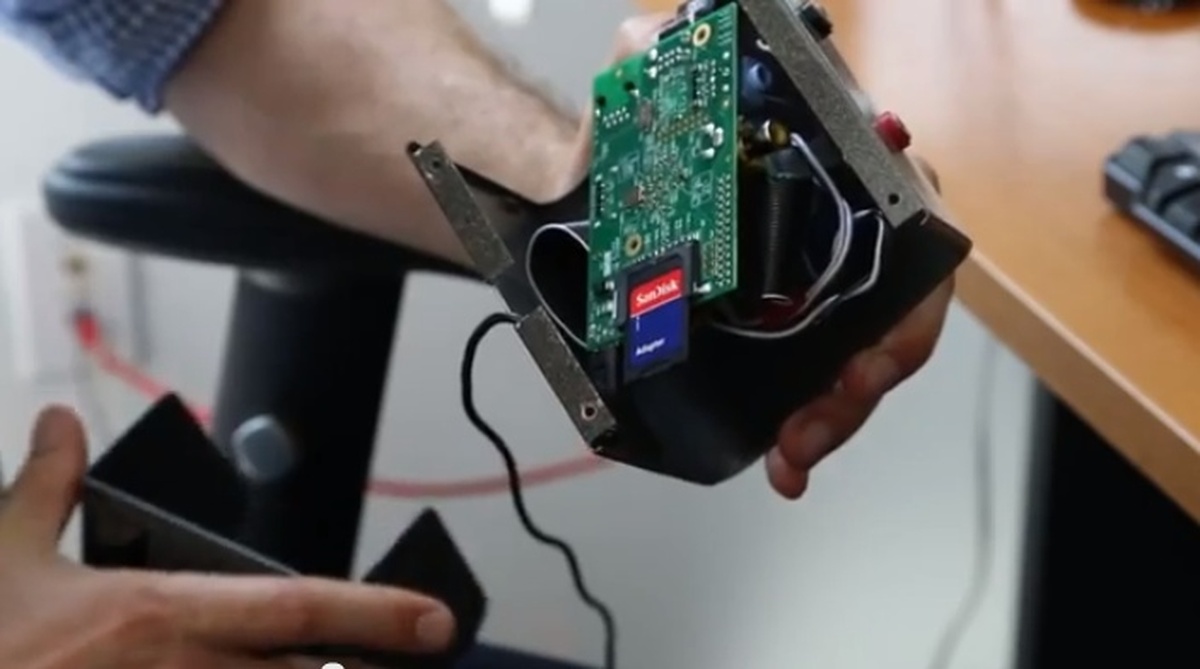
The meter’s Raspberry innards
We spotted Tom Lee’s Lobbyist Registration Meter video on YouTube this morning and it made our day. Lee, director of the Sunlight Foundation’s Sunlight Labs, used an old voltmeter, a Raspberry Pi, and Sunlight Foundation data to create a meter that physically displays the number of new lobbyist registrations in Washington, DC. Lee very kindly agreed to answer a few questions about his setup and the data behind it.
The Lobbyist Meter
Q. This is such a great way to simply, playfully communicate data that you’re already tracking at the Sunlight Foundation. When you found the voltmeter, did you know immediately what you wanted to use it for?
I knew I wanted to stick a Pi in it, but I wasn’t sure what I would use it to measure. I’ve built projects like these before, but usually for transit data, and using less precise/more poorly-constructed tech. Uncommon Objects had a bunch of really beautiful vintage radio gadgetry on display, though—I knew I wanted to get something for a project.
Q. If I wanted to replicate the general function of the Lobbyist Meter, what would I need besides a Raspberry Pi and the physical voltmeter? Where would I start?
You’d probably need a working knowledge of Linux and access to a Radioshack. For playing with the Pi, I can’t recommend Adafruit’s tutorials highly enough (lesson 4 is particularly relevant to this project). I’ve never taken any electrical engineering classes, just stumbled my way through hobbyist materials and imposed on the generosity of the folks on the HacDC mailing list. So it’s a little hard to say exactly which bits of knowledge are most relevant to this. But for anyone looking to get started with hardware as a hobby, I can recommend the MAKE: Electronics book as well as Practical Electronics for Inventors. That, and soaking up context from sites like Hack A Day, MAKE, Evil Mad Scientist, Bunnie Huang’s blog, and whoever they link to.
The Data Behind It
If we dig into the data that runs the meter, what kinds of patterns can we expect to find beyond the weekly ebb and flow of lobbyists?
Lobbying data is both fascinating and flawed. At Sunlight, we think of political influence and the ways it distorts our government as being about human relationships—it’s not just about financial quid-pro-quo, though of course the flows of money are one important signal we use when trying to understand these relationships. You can do a lot of things with this sort of data. I’m especially proud of a recent clustering analysis we did of the groups trying to influence the immigration debate. But there are real limits: some of the most important information is disclosed as free text. Enforcement of the laws on disclosure is basically nonexistent—a huge number of people lobby but don’t register as lobbyists. And disclosures aren’t as informative or accessible as they should be. We make a bunch of specific recommendations for lobbying reform here. If people are interested in using the data themselves, they can find it (and a lot more) on Influence Explorer, including bulk data and API interfaces.
Q. If we look at the surges of specific industry lobbies that you track on the site—telecom, for instance, or insurance—what are we seeing? Do they match up in predictable ways with current legislation under consideration, or are there other patterns you need to know more about DC to understand?
This is a really fascinating question. In fact, it’s the subject of the dissertation of our senior fellow, Lee Drutman. He’s got a shortened, easily-understandable version at that link. But the even-shorter version of his theory is that when government starts paying attention to an industry, it comes to Washington and sets up shop. But after the bill gets passed or the regulations written, the industry doesn’t leave. Lobbyists are in the business of convincing people of things, after all, and they’re pretty good at convincing their bosses back at corporate HQ that it’s important to keep them in DC and on the payroll. And they then find things for themselves to do. This winds up junking up the system.
But more specifically: yes, you can often see surges by topic as new issues gain salience. The forms do require that a category for the lobbying activity be chosen—our Lobbyist Registration Tracker breaks all of this out. Some of these are catchall categories, or evergreen topics—”budget & appropriations,” for instance—but others vary based on what Washington is talking about.
The Meters of the Future
Q. Can we have a giant lobbyist meter installed at the train station or the airport, please?
5. Yes! Oh man, I would love that. Actually, though, what I really want is to build some projects using those beautiful, clacketysplit-flap displays that you see in train stations. As far as I can tell, nobody makes them anymore, and it’s getting harder and harder to find used modules on ebay. If any of your readers know where to get some, they should drop me a line! For now I’m going to have to content myself with a few of these frighteningly large 7-segment displays.
The Video
Here’s the video for your Friday afternoon enjoyment.
Credits
-
 Erin Kissane
Editor, Source, 2012-2018.
-
Tom Lee
Policy @ Mapbox. Before: CTO @ Sunlight Foundation. Other than that my Github’s mostly firmware for Halloween costumes.


