Features:
Replaying A Night in the Life of a Cabbie
How we made it: goals, approach, code
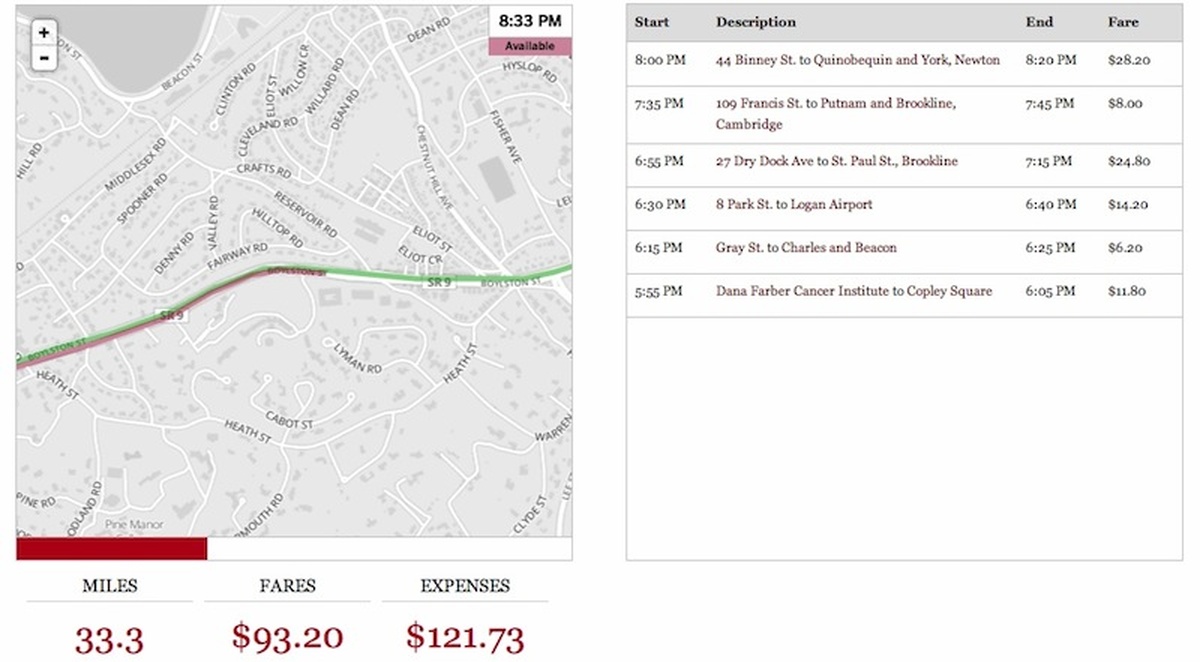
As the evening goes on, the Globe’s cabbie is still in the red. (Dan Schultz/Boston Globe)
One of the best things about working at a newspaper is that there’s an interesting story in everything. Take cab driving for example: it’s just someone sitting behind a wheel for eight hours driving random strangers around, right? Wrong. It’s actually a day-long struggle to make ends meet in an world full of corruption and risk.
At The Boston Globe, I was charged with helping readers understand that struggle—to experience a night in the life of a cab driver—using a digital interactive. The result was published alongside an amazing article by the Globe’s resident journalist-sportswriter-cabbie, Bob Hohler.
How do you tell an eight-hour story in a few minutes?
My goal was to give the reader the experience of being down $120 and needing to earn that money back, not knowing exactly when or how that might happen. Bob had spent a week as a cab driver taking copious notes, so I had data. In particular this meant:
- Pickup and drop-off time / location pairs
- Fares (including tips)
- Notes about the passengers
- A general sense of what routes were taken
Aside from the passenger notes, it was pretty dry. I needed to find a way to present the story in an engaging way.
At the time I was on a serious Skrollr kick. Skrollr is a tool that creates a fairly unique reader experience by allowing the user to move through animations at his or her own pace by “scrolling” to trigger progress. What if someone could drive around Boston by scrolling?
That one’s easy: it would be tedious. But if you take out the scrolling part it’s not so bad. Without scrolling, you are left watching a route grow before your eyes, having animation that actually tells a story, and not being sure what exactly would happen next. That, at its core, is perfect material for a mesmerizing experience.
The concept brought me back to After Dark.
So there you sit, watching this cab drive all over Boston and before you know it a few minutes have passed. You glance down to the totals. You’re expecting the driver to have made a fair chunk of change—he’s three hours into his shift after all—only to see that he is still deep in the red. Mission accomplished.
What Had to Be Built
Animated maps aren’t new, but existing tools don’t animate a route so much as they animate a marker along a route. This creates a far less compelling experience for a cab interactive since it’s hard to appreciate the big picture without seeing it.
Lines on maps are called polylines, and polylines are basically just a list of locations that the computer uses to connect the dots. Marker animations create one point and move it around, but if you decided to instead add that point to a polyline it looks like the line has gotten a little bit bigger.
For example…
	var line = new Polyline();
	requestAnimationFrame(function() {
	  var point = getNextPoint();
	  line.addPoint(point);
	});
I needed code that would:
- Take the cabbie’s pickup and drop-off locations and convert them to actual routes.
- Use maths to take those timestamped routes and find the exact location of the cab at any given a moment.
- Simulate the passage of time by regularly looking up locations and adding to the polyline’s point list.
Calculating the Routes
The information from Bob was stored in a Google spreadsheet and looked something like this:
"5:55:00", "6:05:00", "4 Jimmy Fund Way, Boston, MA 02115", "Dartmouth St. and Boylston St.", "11.8", "Three women returning to their hotel"I used Tabletop and the Google Directions API to generate the routes (adding in a column to the spreadsheet to enable waypoints, since Bob is some kind of crazy genius and was able to remember the specific paths he took five months ago). Google’s API gives you a lot of information about the route it generates, but all I needed was the resulting polylines and distance calculations.
I wrapped all the table and direction data for each fare into a single, a giant JSON blob. That blob was added to a cache file so that I wouldn’t need to rely on all these APIs in production.
Extracting Locations
Looking up the points to add to the animated lines comes down to a single function: getPositionAtTime(). The function takes in a time in “hh:mm:ss” format and accesses the JSON blob to calculate and return the LatLng position of the cab at the specified moment.
The first step is to figure out which fare the driver is pursuing. The application knows when each fare starts and ends so this is simply a matter of looping through the list and stopping once you find the right one.
	function getRouteAtTime(time) {
	 for(var x in merge_data) {
	  var route = merge_data[x];
	  if(time < route.start || time > route.end)
	   continue;
	  return route;
	 }
	}
Once the route has been identified, you need to hammer out how far into the route the cabbie has traveled into it. This can be done with with some arithmetic:
var completed_distance = route.distance * (route.end - time) / route.endYou might notice that this requires a simplifying assumption. You have to pretend that the cab driver maintained a constant speed within each fare. For example if the fare route was 5 miles long and the spreadsheet said that it took 5 minutes, this simulation assumes that the driver was moving 60 miles per hour the entire time.
Sounds legit.
Anyway, routes returned by Google are made up of steps, so now you need to know which step lines up with that completed distance. While you do that you should keep track of how far you have traveled so far because that feels like relevant information.
	for(var y in route.steps) {
	 var step = route.steps[y];
	 if(total_distance > odometer + step.length ) {
	  odometer += step.length;
	  continue;
	 }
	 // At this point we're working with the correct step
	}
It’s almost time to enter the land of LatLng and polylines, but before we can do that we need a unit-less measurement of how much of the path you have completed (Google distances are in meters, polyline lengths are in who-knows-whats).
var completion_percent = odometer - completed_distance / step.length;Polyline time! I said earlier that a polyline was a list of points. That’s one way of thinking about it, but you could also call it a list of lines. For example, three points (A, B, C) can be rewritten as two lines (AB, BC).
This is important because the value you’re looking for (the exact location of the driver at a moment in time) isn’t actually going to be one of the points in the list. It’s probably falls somewhere along the lines connecting those points.
Now you need to know the total polyline length. From there you can multiply the total length by the unit-less completion percentage that we defined earlier to get the progress along the polyline. This can be done by looping through the points and doing some good old fashioned geometry.
	var polyline_length = 0;
	var pointA = null;
	var pointB = null;
	for(var z in step.polyline.points) {
	 pointB = points[z];
	 if(pointA != null)
	  polyline_length += Math.sqrt(Math.pow(pointB.lat - pointA.lat,2) + Math.pow(pointB.lng - pointA.lng,2));
	 pointA = pointB;
	}
Once that’s finished, factor in the completion percent to mathalize how far along the winding path the cab has traveled.
var length_traveled = polyline_length * completion_percent;Now it’s time to loop through the polyline’s lines, adding their lengths to an odometer as we go. You can only stop once you get to the line containing our fearless cabbie.
	var length_odometer = 0;
	pointA = null;
	for(var z in step.polyline.points) {
	 pointB = step.polyline.points[z];
	 if(pointA != null) {
	  var line_length = Math.sqrt(Math.pow(pointB.lat - pointA.lat,2) + Math.pow(pointB.lng - pointA.lng,2));
	  if(length_traveled > length_odometer + line_length) {
	   length_odometer += line_length;
	  } else {
	   // We have the line we're looking for!  Almost there...
	  }
	 }
	 pointA = pointB;
	}
Now that you know which line the cabbie is in you can figure out how far along that line he has gone.
var length_progress = (length_traveled - length_odometer) / line_length;Since the line is straight you can calculate the position along that line based on the length progress:
	var lat = pointA.lat + (pointB.lat - pointA.lat) * length_progress;
	var lng = pointA.lng + (pointB.lng - pointA.lng) * length_progress;
	return [lat,lng];
Amazing! We did it! Here’s the full code:
	function getPositionAtTime(time) {
	 var route = getRouteAtTime(time);
	 var completed_distance = route.distance * (route.end - time) / route.end
	 for(var y in route.steps) {
	  var step = route.steps[y];
	  if(total_distance > odometer + step.length ) {
	   odometer += step.length;
	   continue;
	  }

	  var completion_percent = odometer - completed_distance / step.length;

	  var polyline_length = 0;
	  var pointA = null;
	  var pointB = null;
	  for(var z in step.polyline.points) {
	   pointB = points[z];
	   if(pointA != null)
	    polyline_length += Math.sqrt(Math.pow(pointB.lat - pointA.lat,2) + Math.pow(pointB.lng - pointA.lng,2));
	   pointA = pointB;
	  }

	  var length_traveled = polyline_length * completion_percent;
	  var length_odometer = 0;
	  pointA = null;
	  for(var z in step.polyline.points) {
	   pointB = step.polyline.points[z];
	   if(pointA != null) {
	    var line_length = Math.sqrt(Math.pow(pointB.lat - pointA.lat,2) + Math.pow(pointB.lng - pointA.lng,2));
	    if(length_traveled > length_odometer + line_length) {
	     length_odometer += line_length;
	    } else {
	     var length_progress = (length_traveled - length_odometer) / line_length;
	     var lat = pointA.lat + (pointB.lat - pointA.lat) * length_progress;
	     var lng = pointA.lng + (pointB.lng - pointA.lng) * length_progress;
	     return [lat,lng];
	    }
	   }
	   pointA = pointB;
	  }
	 }
	}
Animation
Once you have a getPositionAtTime method the animation is actually pretty simple. All you need is a heartbeat that will move time along, look up a point, and add it to our line.
	function tick() {
	 time += 5;
	 var point = getPositionAtTime(time);
	 active_line.addLatLng(point);
	 heartbeat = setTimeout(function() { map.whenReady(function() {
	  requestAnimationFrame(function() {
	   tick();
	  });
	 })}, 100);
	}
Almost finished, but there’s a bit more that has to be done. You have lots of routes, and each route gets is own animated line. The problem with the animated lines is that after the animation is finished they are full of un-necessary points. Computers don’t like un-necessary points.
This means that every time a fare is finished you need to delete its animated line and replace it with the optimized, original polyline.
	active_route.renderPolyline();
	map.removeLayer(active_line);
	active_line = new Polyline([getPositionAtTime(time)]);
And with that you have a line animation loop.
Final Notes
There are other features included in the interactive (distance counts, fare notes, the ability to jump around the animation by clicking the progress bar, the timer, etc). If you’re interested in those just view the source and try not to judge.
Speaking of judgment: this code is super duper non-optimized. It could be several orders of magnitude faster by throwing in some clever tricks and caches. But the fact is it works, and it works across platforms. That’s the most important requirement you face in a newsroom!
Still, there’s plenty of room for improvement, and a Leaflet plugin that should probably be written on a rainy day. Until that day I’ll leave you with this haiku pun:
A cabbie’s long night
retold by a programmer
JavaScript driven
Credits
-
Dan Schultz
Elected member of Cheltenham School Board; Technologist; Loving Troll; Internet Archive; Knight; Mozilla; MIT Media Lab; Carnegie Mellon; Bad Idea Factory


