Features:
It’s time to rethink how we report election results
From early counts and early calls to maps that reinforce bias, our traditions are contributing to a democratic crisis
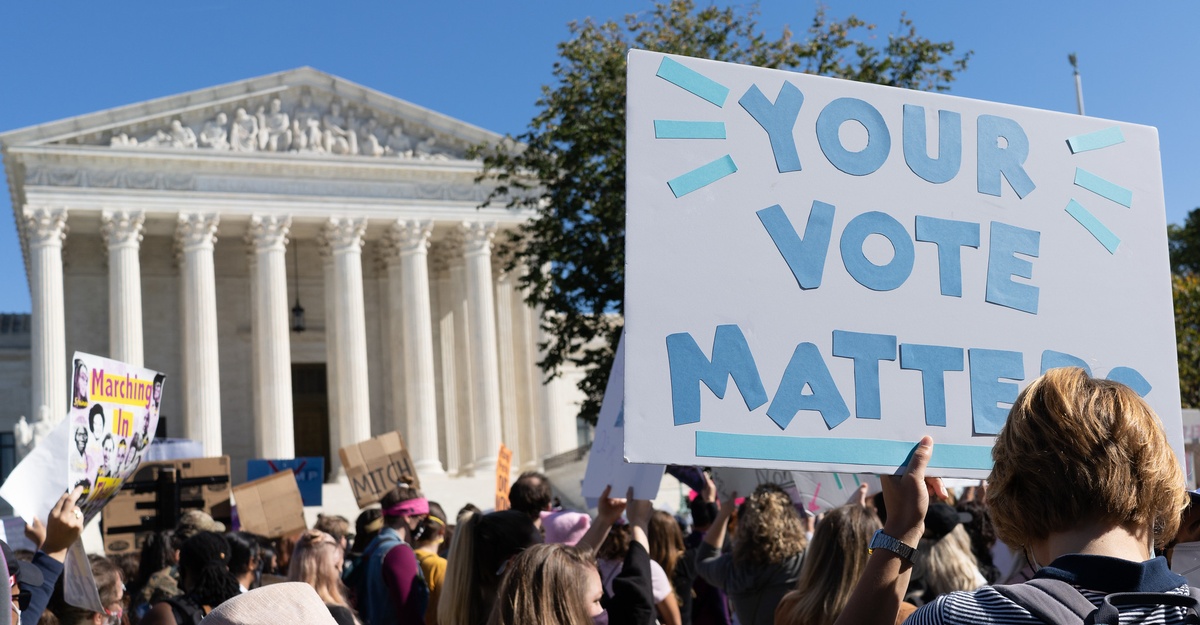
People gather for the Women’s March in Washington, D.C., in October 2020. (Photo by Victoria Pickering)
As long as I’ve been in this industry, I’ve heard election night described as the peak “news nerd holiday.” An election is also a huge economic event, a spike of reader attention and intense search traffic that’s addictive. That makes it hard for newsrooms to think clearly about what an election means, much less make decisions that might reduce the flow of pageviews.
But in the wake of the Trump era and the January 6 insurrection, it’s time for us to step back and take a clear-eyed look at what our election coverage is actually doing—and how it may have played a role in this democratic crisis.
If you’re reading this, you and your peers probably have some influence over how your newsroom handles results. Maybe more than you think! You can make the argument for (and build the implementation of) pro-democracy election results.
At a bare minimum, there are simple, straightforward steps you can take (or more precisely, stop taking):
- Stop reporting results that are too early to be useful or informative. Require a 50–75% threshold before showing vote counts, so that early swings don’t confuse readers.
- Stop rushing to call races when it undermines confidence and feeds conspiracy narratives. Delay calls until they agree with the current vote tabulation, and consider holding them altogether until most results are complete.
- Stop creating maps and visuals that reinforce biases about geography and voting. Land doesn’t vote—we shouldn’t use it as the basis of graphics about people, or about the electoral college.
If you want to go beyond harm reduction and help transform election coverage into something that actually improves democracy instead of just observing it, read on. We’ll take a look back at what went right and wrong in 2020, see how the culture of data journalism has contributed to the problem, and finally start a conversation around a fundamental shift in political data reporting.
Getting ready for 2020
I’ve built digital election results for more than a decade, in three very different modes. At CQ-Roll Call, I published balance of power breakdowns for a small, select DC audience in 2010. For The Seattle Times, from 2014 to 2017, I handled the data processing and display for local, state, and national election results. Most recently, I joined NPR the day before the 2018 election, and led the project team that completely rebuilt our results rig last year.
One of the most jarring contrasts around 2020 results was that we did a lot, as an industry, to warn voters about the potential irregularities and issues. At NPR, we had a reporter essentially on “voting” as a beat for much of the year, specifically covering voting by mail, its security, and historical trends.
From the start, it was clear that misinformation about the 2020 election was going to come from the very top. Professional political journalism did not handle Trump particularly well, but there were plenty of stories where Trump refused to commit to accepting the results of the election if it didn’t go his way. Instead, he would make wild, evidence-free statements to undermine confidence in voting, laying groundwork for his post-election strategy.
This was, of course, in addition to the standard misinformation about elections. Right-wing politicians and commentators have regularly made false accusations of fraud, such as voters being bussed across state lines or illegal votes by immigrants. Apart from the rhetoric, there were organized efforts to reduce voting numbers, by interfering in the postal service, rejecting ballots, and creating long wait times for non-white areas.
Given this hostile environment, the NPR News Apps team looked at the reporting our newsroom was doing and held a “threat modeling” session. We brainstormed all the potential ways that things could go wrong, including legal challenges in multiple states, unclear results, and potential violence, and then we used that to influence the design of our results in partnership with the Washington desk. We also built a number of safeguards into our data pipeline, so that we could override or flag individual races as needed.
When it came time to build our results, we placed a note at the top of every page detailing potential issues, noting that delays were entirely normal, and linking to our pre-election coverage. We set a 50% reporting threshold before adding indicators for “leading” in races. And we built new visualizations for the national results that would emphasize votes and margin over geography.
In discussions with political editors, I often got the feeling that they thought we were being paranoid. As a result, we often compromised on the degree of appropriate caution. After January 6th, I think we weren’t paranoid enough.
Where we went wrong
The events of the last few years have highlighted a lot of flaws in journalism that were always there, but can no longer be glossed over as “tradition” or standard practice (e.g., a lot of crime reporters suddenly discovering that the police lie to them, and have for years). Similarly, nothing we did wrong in 2020 is particularly new. Election result displays have been problematic for as long as I can remember, but this year threw those flaws into sharp contrast.
Counts and tabulation
Let’s start with the most fundamental level of results: tabulation. Our conceptual language around tabulation is often broken. We speak using terms like “leaning,” “trending,” or “shifting,” with the implication that the numbers are fluid or reacting over time. But of course, when the polls close, all the votes are set. Their totals do not change. We just haven’t completed the process of addition.
Every election I’ve ever worked, we’ve warned readers that the early results are deceptive: they come from rural precincts, tend to lean GOP politically, and do not include the majority of the population of the state (which live in urban areas). We treat this as though it’s an education problem, when it’s actually an editorial problem. If the early results are untrustworthy, why report them at all?
It doesn’t make any sense to talk about what the early vote counts look like when you’ve just started the adding process. It would be like making a statement about what a puzzle looks like when you’ve only assembled the edges. It’s certainly not clear what the value of announcing percentages for 10% of tabulated votes is, other than it helps fill time on air, and it contributes to pointless drama in political coverage.
Those conceptual biases towards narrative are not just textual, they’re also visual.

Take this set of graphs from the New York Times. These charts are not about vote count (which, remember, only goes up), they’re about vote share over time, which is meaningless. We don’t decide elections based on who was ahead at 25% or 50% of ballots counted. The thing that matters is the total.
Tabulation is also not a statistically random sampling process–there’s an order bias to it. You can’t look at tabulation and say “there’s a trend here,” but that’s exactly what these graphs try to do. Remember: Biden won Pennsylvania and Wisconsin!
Ironically, the NYT rolled out a new iteration of its much-despised needle for predictions in 2020, and justified it by saying that “incomplete election results are often deeply unrepresentative.” Not unrepresentative enough to avoid plotting over time to the tenth of a percent, apparently.
Early calls
We spent weeks, as a news industry, telling people that there were going to be delays, that those delays were normal at the best of times and could be exaggerated by absentee voting during a pandemic. All of this caution was thrown to the wind on election night.
By 9 p.m. Eastern time, 23 states had been called by the AP, totalling 195 electoral votes. A third of the country was essentially crossed off only two hours after the first polls closed. Seven more states (and DC) were called by the end of the night.
These calls often feel baffling even if you’re aware of how the process works. The AP called Virginia early into the night, 36 minutes after polls closed. At the time, the reported totals had Trump leading the vote count. As a result, our voting graphics at NPR presented the bizarre sight of a solid-blue VA drifting out far to the right of all the other called races, and Alabama performing the same magic trick on the left.

Not only do election desks call races before a majority of votes are totalled, they often call them before any votes are counted publicly. It’s a regular headache for newsrooms using AP election feeds: The data will mark a winner as called with 0 votes cast, which is hard to explain to readers. At The Seattle Times, we intentionally ignored AP calls for this reason, and only marked them manually.
There’s no real ethical or legal requirement that forces news organizations to call states so early. In fact, something we often forget is that all these results are unofficial: Most states do not certify results until late November, and certification was not complete for all states until December 11 in 2020.
Election calls are not, generally speaking, proven wrong. I have the utmost respect for the statistical wizards who make them. But in an environment where a candidate has spent months insisting that the contest is rigged, it’s difficult to conceive why calls can’t be delayed until they’re in sync with the tabulated results—which usually only requires an additional hour or two. To do otherwise is at best disorienting, and at worst contributes to an atmosphere of conspiracy and distortion around American democracy.
Visual accuracy and perspective
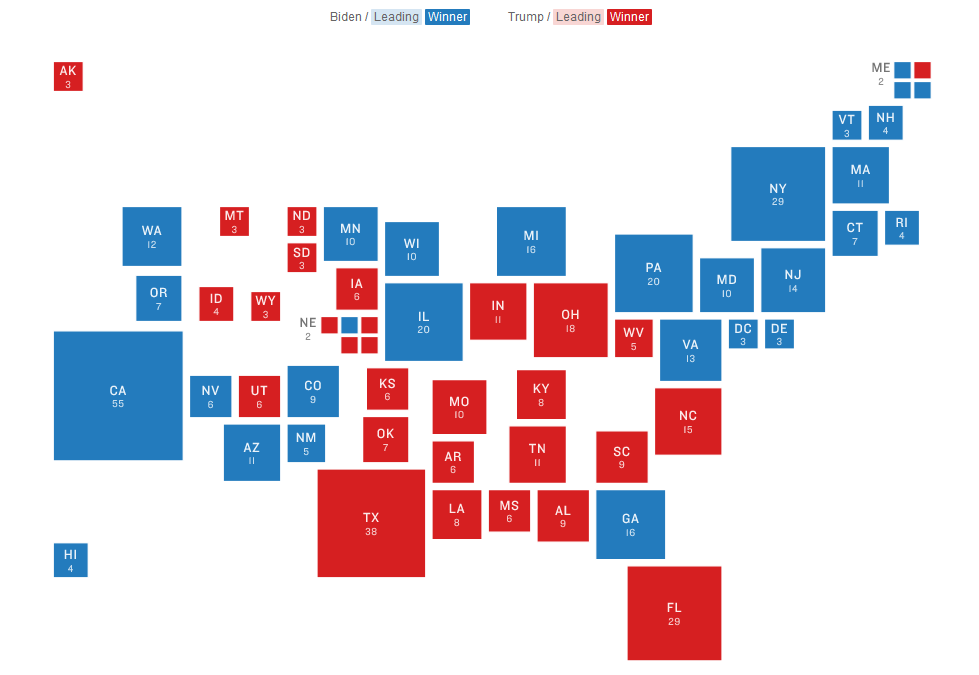
This is our preferred map at NPR for electoral results. It’s a straightforward cartogram, attempting to place the states roughly in geographic space so that people don’t have to search (a problem with hex maps). It was really gratifying how many newsrooms ran cartograms for results last year.
Unfortunately, this map was the default view that greeted you on NPR’s election pages for the first time in a decade.

This map is a lie. It represents electoral votes using geographic space, dramatically overstating the importance of places like Montana or North Dakota, which are mostly empty space, compared with states like Virginia or New Jersey. This is not only inaccurate, it’s politically-biased, playing into political distortions about “real America” and “real Americans.” We misled our audience when we put this map at the top of our results.

Even worse are county displays (this map is from Fox News, but other organizations used similar graphics). Counties don’t mean anything as an electoral concept, at least for national office. Even in states with split electoral vote assignment, it’s done by district, not by county. Most of those red counties are dramatically underpopulated, compared to the blue urban areas. There’s no rational purpose in showing a map of the US with counties marked, unless you want to mislead people about “how much” of the country votes a certain way. Not coincidentally, Trump was known to have handed out county-level results in 2016 as part of his argument that he actually won most of the popular vote (he did not).
County and state maps don’t represent people, they represent dirt. Dirt doesn’t get a ballot.
The failure of results is tied to systemic issues in data journalism
Elections are a natural data-oriented story, which means a lot of us have ended up working on them as an annual (or bi-annual) ritual. Especially if you’re in a newsroom where you don’t feel particularly respected, being a crucial part of one of the year’s big stories (and the nightly pizza) means a lot.
But that same eagerness means that we have not, historically, been particularly good about pushing back on poor choices, or even thinking about the choices that we make. If you’re used to getting crumbs, you don’t complain much about the provenance of the cake.
It’s also sometimes hard to push back because a lot of the bad ideas are really interesting technical challenges. Building county-level results that perform well is hard. Building a page with a bunch of live countdown counters is hard. Building predictive models that can power a shaking needle is hard! I legitimately hate election coverage, and yet the code that I wrote for 2020 is some of my most elegant, well-designed work.
You can put off thinking about the ethics of an action for a long time if you get caught up in the mechanics of it.
Some data stories are easier to assemble than others
It’s easy to forget how monumentally difficult the process of getting results is. Anyone who’s worked in local news, or contributed to the Open Elections project, can tell you that every state has at least one horrible format for elections. An enormous amount of energy and effort goes into an AP results feed, and I genuinely respect that. But it means that we tend to build around the data that’s easy to get.
By contrast, there are datasets that you can’t get through AP, DecisionDesk, or Edison:
- Average wait time to vote
- Average voters assigned per polling place
- Votes rejected or deferred
- Voters challenged, and by whom
These datasets are not about the contest, they’re about the accountability of the process. Which, I would argue, is just as important.
This other data is hard to gather. Again, all voting data is hard to gather. Lots of data is. But look at things like the Washington Post’s police shootings database—just because it’s hard doesn’t mean we shouldn’t do it. And of course, if we do it regularly, it gets easier.
What do election results actually measure?
We tend to present election results as divorced from outcomes. But elections have consequences. People get deported. They die in increasing waves of climate disaster. They’re denied gender-affirming medical care. They get sick during a pandemic. They get arrested and shot by racist police departments.
You can’t see that in our results, because they treat the election as a spectator sport we’re just bloodlessly observing.
I’ve become convinced election results are the ultimate View from Nowhere, and I’m increasingly uncomfortable working on them.
So what do we do about it?
Ideally, I would like us to stop displaying real-time results altogether, and we should stop running predictions as a part of our coverage. These things are bad for our relationship with our audience, they’re bad for journalistic standards, and they’re bad for democracy.
But that’s not going to happen in most places (unless you are a politics editor or a reporter with a lot of pull, in which case let’s talk). The addiction to the traffic numbers and the newsroom habits are just too strong. So how do we convince our organizations to be less harmful?
At SRCCON 2021, I asked participants to think about four challenges for better results:
- Visual results: Sketch a visualization for results that presents them responsibly.
- Data sources: Think about datasets that you have, or would like to have, that could be merged or juxtaposed with election results.
- Pre-election coverage: Imagine story ideas or topic areas that would benefit Americans in the run-up to an election. Keep in mind who reads your coverage—and who doesn’t.
- Reporting on power: Elections are not just about who wins or loses, but who will face material consequences as a result. How can our reporting reflect that?
In response, participants spoke about ways to bring new context to our elections. For example, reporting on misinformation should stress historical context, noting that the myths about voter fraud have persisted without evidence for decades. Likewise, coverage of state and local election laws that influence elections needs to be a priority in newsrooms—not just before the election, but afterward. As new, restrictive voting laws are passed, retrospectives about their impact on elections will be a crucial part of holding the process accountable and enabling democracy to recover.
While it may be tough to convince newsrooms to change their approach overnight, we can start to move the Overton window within our field toward equity. To that end, there are concrete steps that newsrooms can start to take now, ahead of 2022, to start that shift:
First, consider the election as a process, not an event. Plan for sustainable coverage before and after election night. Align your engagement goals toward creating loyal audiences from your coverage, not just capitalizing on a burst of traffic and attempts to “win the night.” On data teams, diversify your data sources to bring in rich additional context for readers around all of voting, not just a count of current votes.
Next, slow down and reduce drama for drama’s sake. Hold results displays until a large portion (say, 50% or 75%) of votes are counted, so that you’re not just showing people the wild swings from the early returns. Reconsider maps and visuals that play to narratives of a polarized country, and instead highlight issues like the time delay of full tabulation, population density and voting patterns, or who doesn’t vote (and why).
Finally, make a place in your reporting for service journalism. Think about how to answer reader questions in a way that strengthens democracy. Where do I go to vote? What are my voting rights? How do I check if I’ve been dropped from the polls? How do I guard myself against laws and activism meant to disenfranchise me?
Engaging honestly with this process will mean giving up some of that big traffic rush. It’ll also mean discarding the illusion, long-held in political journalism, that we’re merely “objective” observers and not participants in political discourse. But if we want to have a healthy democracy to cover, those are sacrifices we need to consider.
Credits
-
 Thomas Wilburn
Thomas Wilburn is the Senior Data Editor for Chalkbeat, a nonprofit newsroom focused on education. Previously, he was a senior developer for the NPR News Apps team, and a founding member of the Seattle Times Interactives team.


