Features:
Story recipe: U.S. schools restrain and seclude students thousands of times per school day—how often where you live?
Here’s how to find the data and explore it, plus questions to ask in reporting the story for your community
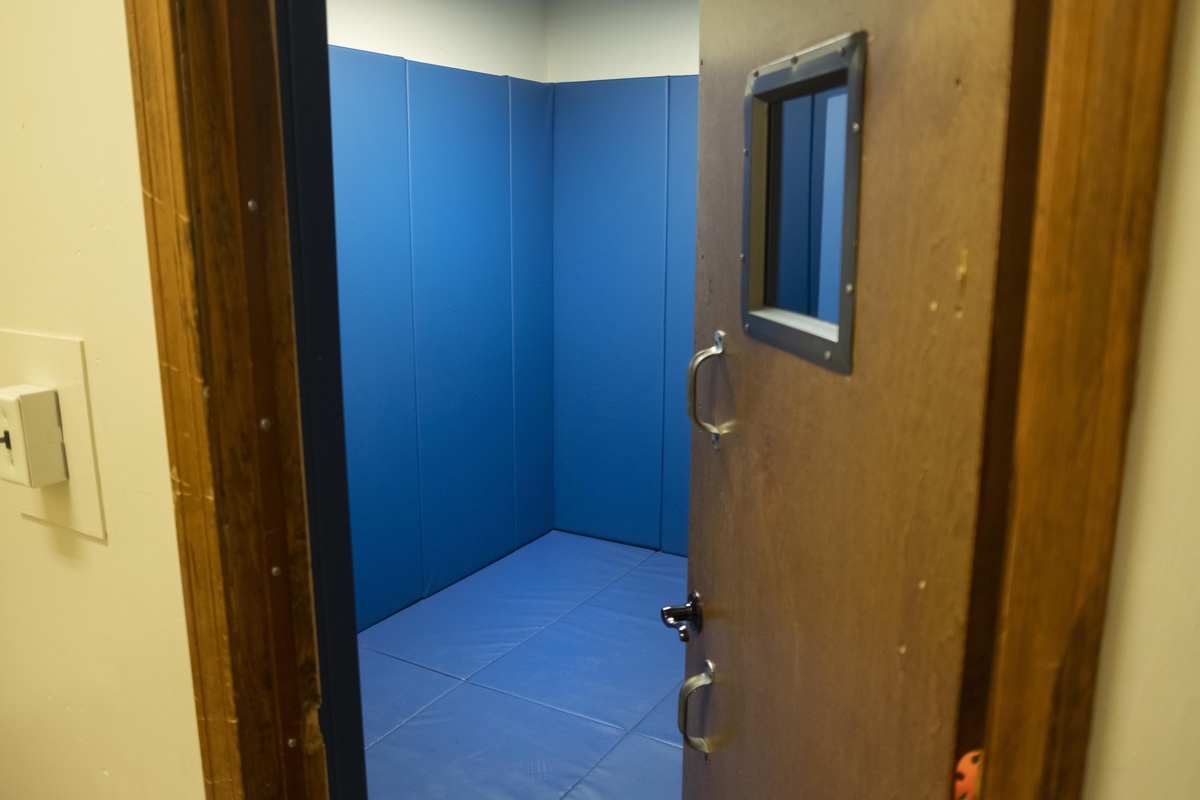
A time-out room at a school in New York, from a Hearst Newspapers investigation using data about the nationwide use of restraint and seclusion in schools. (Times Union)
Every day in public and private schools across the country, children are “restrained”—physically held by staff members, pinned to the ground, or bound by mechanical devices such as straps or handcuffs. Other times, students are kept in “seclusion,” confined alone in rooms ranging from windowless small supply closets and bathrooms to spaces resembling padded cells.
When we learned about a case of a student being restrained and secluded in Connecticut, we wondered: How often does this happen? That question sent a team of reporters from across Hearst Newspapers digging for more than a year.
The story we found
Restraint and seclusion, which are legal in most districts nationwide, are commonly used when students—particularly those with disabilities—are in distress, engaging in self-harm or acting in ways that could cause injury to themselves or others. These practices are used thousands of times per school day nationwide. They cause thousands of injuries to students and staff members each year.
Our investigation found that, since 1989, at least 85 children, teenagers and young adults 21 and younger have died after being restrained or kept in seclusion in public and private schools, juvenile justice centers, residential facilities or other settings that cater to people with special needs.
The reporting was led by two of Hearst Newspapers’ teams of data reporters in the northeast and Texas, with support from news engineers from Hearst Newspapers’ DevHub.
We explored national trends around the use of restraint and seclusion, the landscape of laws around the country and alternatives to restraint and seclusion that are being deployed in some schools. We also honed in on the use of these methods in several states where our newsrooms are based, particularly New York, Connecticut and Texas.
The investigation was supported, in part, by an award from the Data-Driven Reporting Project. The Data-Driven Reporting Project is a partnership between Medill at Northwestern University and the Google News Initiative, and awards funds to investigative journalists working for local news outlets and outlets serving underrepresented communities across the U.S. and Canada.
We used the funding primarily to cover costs associated with using Amazon Textract, a machine learning service that extracts text, handwriting and data from scanned documents. We’ll go over how Textract helped us turn tens of thousands of pages of paper- and PDF-based school incident reports with handwriting into structured data sets below.
How you can analyze the data
To report this project, we relied on three kinds of data: federal data collected by the U.S. Department of Education on all schools around the country; state data collected by state education agencies on schools in their jurisdiction; and school data and records obtained from individual public schools.
Data from the federal government
As a starting point, you may want to check out how many restraint and seclusion cases schools in your area have been reported to the federal government. You can search the data reported by any school in the country using the database we published.
We built this tool using publicly available data from the U.S. Department of Education’s Civil Rights Data Collection. Every two years, DOE asks schools to report data on numerous education topics, including restraint and seclusion. Due to the pandemic, the most recent data available is from the 2017–18 school year. New data is expected to be released in 2023.
This dataset has flaws, most notably significant underreporting, which we describe in this article. But in some states it is the most complete data available, and generally, you might want to know what schools in your area are telling the federal government about how they use restraint and seclusion. Some schools also have declined to report for years.
To access the data, visit ocrdata.ed.gov. You can find overviews of the cases reported in each state at ocrdata.ed.gov/estimations/2017–18. Here’s how to explore the school-by-school data in your state:
1. Go to ocrdata.ed.gov/resources/downloaddatafile and download the latest CRDC dataset. NOTE: Your experience may vary, but Firefox seemed to have trouble downloading the full data file. Chrome worked great.
2. Open the file. The file will contain a folder called “Documentation” that explains the file structure of the datasets and gives technical documents. You’ll want to have this information handy. The data is in the aptly-named “Data” folder.
3. To explore the data by school, inside the “Data” folder, open “SCH,” then “CRDC,” and then the “CSV” folder. You will see many spreadsheets on various education topics. Open the file called “Restraint and Seclusion.” You’ll then be faced with a massive file containing all restraint and seclusion data for all schools in the country.
4. It may be helpful to filter the dataset to your state (or even further, to the school districts in your coverage area) and save that data into a new smaller file that is easier to work with. You can do that by filtering on the columns LEA_STATE or LEA_STATE_NAME and copying the remaining data into a new file.
5. When you’re honed in on the local schools you want to analyze, it’s time to start exploring what they reported. Use the spreadsheet “2017–18 CRDC File Structure” from the “Documentation” folder to understand the “Restraint and Seclusion” column headers. To get the total instances of restraint and seclusion in a given school, sum the following columns:
SCH_RSINSTANCES_MECH_WODIS + SCH_RSINSTANCES_MECH_IDEA + SCH_RSINSTANCES_MECH_504 + SCH_RSINSTANCES_PHYS_WODIS + SCH_RSINSTANCES_PHYS_IDEA + SCH_RSINSTANCES_PHYS_504 + SCH_RSINSTANCES_SECL_WODIS + SCH_RSINSTANCES_SECL_IDEA + SCH_RSINSTANCES_SECL_504To get the total number of students subjected to restraint or seclusion in a given school, sum the following columns:
TOT_RS_NONIDEA_MECH_M + TOT_RS_NONIDEA_MECH_F + TOT_RS_NONIDEA_PHYS_M + TOT_RS_NONIDEA_PHYS_F + TOT_RS_NONIDEA_SECL_M + TOT_RS_NONIDEA_SECL_F + TOT_RS_IDEA_MECH_M + TOT_RS_IDEA_MECH_F + TOT_RS_IDEA_PHYS_M + TOT_RS_IDEA_PHYS_F + TOT_RS_IDEA_SECL_M + TOT_RS_IDEA_SECL_FNOTE: Zeroes in the data are intended to represent a value of zero, as you’d expect, but be aware that in some cases the school might be inaccurately reporting or declining to report. See this GAO report for more: “Some school officials have expressed confusion in recent years about reporting requirements, and some districts have submitted inaccurate entries, inputting zeroes when data is missing rather than leaving entries blank.”
Negative values in the data should not be used in any calculations; they are codes that represent things like processing errors, missing data, and data suppressed for quality reasons. The Department of Education can provide a full list of these reserve codes (which is too long to list here).
6. Now you can filter or sort the dataset to see which schools reported the most cases in your area or browse by schools that interest you.
We expect that we’ll all be able to follow similar steps to analyze the new CRDC data when it is published. The CRDC data that will be released in 2023 will be from the 2020-21 school year.
Data from state agencies
Depending on what state you report in, your state may have more detailed data on restraint and seclusion available to you.
We requested restraint and seclusion data from every state education agency in the country. You can browse the data that we received from your state and get a basic summary of the state law where you are in this article. (Keep in mind that data from the 2019–20 and 2020–21 school years may have been affected by COVID–19 school closures in many districts.)
Some states may have more detailed data on injuries, rule violations or other elements available than what we were able to summarize in the article above. If your state collects data, we recommend you make a records request to access it. You can also contact us at emilie.munson@timesunion.com or matt.rocheleau@hearstmediact.com with questions or to see the data we have.
How to use Amazon Textract for further records analysis
There’s a ton of reporting you can do just from the federal CRDC data, and even more if your state responds to a request for more detailed or more recent data. If your team is comfortable writing code and wants to really zoom in on an individual school—or if your state collects no data on restraint and seclusion—you may want to request records directly from school districts. We did this in New York and learned valuable information about how some schools were using restraint and time out rooms.
(If you aren’t planning to use Textract, you can also skip ahead to some advice on reporting your data story.)
First, review your state’s laws and regulations around restraint and seclusion and determine whether and how schools are required to document incidents of restraint and seclusion. This is likely key to knowing whether records exist and what to ask for.
Then, place your records requests. We asked for the data or logs of incidents if they existed, but if they did not, we requested reports on individual incidents. We also asked for information on teachers disciplined for their misuse of restraint and seclusion and the results of any internal school investigations. Some schools argued these records could not be released under the Family Educational Rights and Privacy Act (FERPA), but we successfully appealed multiple cases where schools refused to release even redacted records and gained access.
If you request multiple years of data, you may be asking for a high volume of records. It could be expensive to get copies of those records. One school district charged us more than $500, and school districts in Michigan wanted to charge the Detroit Free Press thousands of dollars for their records. We used our DDRP award money to pay for records in some cases.
Also, it may be prohibitively time consuming to read and analyze every report if you receive a high volume of records. This is where we used Amazon Textract.
Textract is a powerful tool that can read image-based PDFs containing handwriting, text, and numbers. These kinds of PDFs cannot be read by other tools like Tabula or Python libraries such as Camelot. We used Textract to quickly read more than 10,000 pages of PDFs obtained from New York schools and output data into spreadsheets.

A screenshot of Textract in action during Hearst Newspapers’ analysis.
Textract is not free for most analysis, although you can try a free demo on a sample of documents. There is a charge per page read by Textract. We spent approximately $700 to use it.
You can use Textract to extract information from documents if you don’t use a coding language. For our analysis, we found it was most effective to pair Textract with Python.
For these instructions, we’re assuming you, or someone on your team, are familiar with writing your own scripts. Here’s how you can use Textract with Python:
1. Familiarize yourself with your records and decide what you want to extract from them. Are your records structured as a table? Or are they a form or an unstructured narrative that Textract will have to read line by line? What data elements do you want to appear in your final spreadsheet? Do you want one incident of restraint or seclusion to constitute one row of your spreadsheet? If so, is one incident one page of your PDFs, one row of the table, or something else?
2. Once you answer these questions, convert your PDFs into JPGs if they are tables. We used Adobe to do this. If they are forms like incidents records/reports, keep them as PDFs.
3. Add your documents to a local folder and tell Textract whether it should read them as a table or line by line. If you have multiple document types, you can work with them in batches.
4. Once you pay for Textract, you will get AWS credentials and you can use them to access Textract in AWS. Amazon provides some sample code that you can modify to teach it to read your documents. You need to use this code and your keywords to extract the right data, using corresponding value pairs, and input it into your new dataset. In our case, it was a Google spreadsheet. To get accurate output, you will need to “train” Textract on a selection of the documents.
5. For forms, in Python, read all your documents’ text by line and save all the lines into a JSON file. Write another script to read the JSON file and pull out the data you need based on your configurations of key words. Save the output into a CSV file.
6. For tables, our script read the data from JPGs and saved the output as CSV files directly.
We highly recommend spot-checking the spreadsheets with your Amazon Textract results against the original records. If your records are not uniform in format or contain extremely messy handwriting, the results may contain some errors. This may require a fair amount of time to clean up. In our analysis of 22 school districts, we needed more than two weeks to spot-check and clean all the results. We also recommend sharing summaries of your results with the school district to check them.
Reporters looking for an alternative to Textract could try Google Pinpoint’s beta tool for data extraction, which is free for journalists. This tool was not available at the time of our analysis.
How to report your story
Now that you have your data, what are you looking for?
First, you might want to check if the data or records indicate that the school or schools you’re investigating are doing anything that appears to violate state laws or other rules and policies. (You can read more about your state’s law and why there is no federal law governing these practices in this article.) In some cases, state laws ban prone (face-down) restraints, seclusion or using restraint and seclusion methods in some circumstances, like as a punishment or to prevent property damage.
Even if schools are not violating laws, it’s possible some are using these methods—which are generally intended to be last-resort techniques—more frequently than is reasonable. The U.S. Department of Justice and Department of Education have found that some schools use these techniques in violation of students’ civil rights. You may want to use your data or records to explore this question: Of the students being restrained or secluded, how often are they experiencing these interventions?
This is a nuanced subject. You’ll likely need to rely on student, parent, teacher, administrator, and advocate sources to provide important context on how restraint and seclusion are really used in the schools you’re investigating. We particularly recommend connecting with your local federally-mandated Protection and Advocacy group for people with disabilities, special education attorneys, local special education professors or researchers, and Facebook groups for special education parents or teachers.
The student population most often subjected to restraint and seclusion are students with disabilities. They’re often children with autism and sometimes the students are non-verbal. If you’re interviewing these students, check out the resources from the National Center for Disability and Journalism for guidance first. It’s good practice to discuss with the source (or their parent) any accommodations the source may want or need during the interview, and to leave extra time and offer breaks during a long interview.
The National Center for Disability and Journalism also has excellent advice about selecting appropriate language in articles involving disability. We recommend always asking your source how they’d like their disability described in print, if it is relevant to do so.
Lastly, other great journalism on restraint and seclusion has come before us. Our work is unique in the amount of data collection we did. We recommend you also review reporting by NPR and ProPublica.
Find more step-by-step data story recipes like this one. If you have questions about a story you’re working on, our free peer data review program is here to help. If you’re using this story recipe, please let us know — we’d love to promote your work! If you’ve got a story recipe idea, we’d love to hear about it. Drop us a line at source@opennews.org.
Credits
-
Emilie Munson
Emilie Munson is a data reporter for the Times Union. She previously covered federal politics in Washington, D.C., for the Times Union and Hearst Connecticut Media. Emilie also has worked as a state capitol reporter for Hearst Connecticut Media and as an education reporter for the Greenwich Time.
-
Ying Zhao
Ying Zhao is a newsroom engineer for The San Francisco Chronicle and the Hearst Newspapers’ central interactives team (DevHub). She previously worked for KQED in San Francisco, collecting and analyzing police misconduct data, and Hearst Magazines China, where she was a features editor. Zhao is a graduate of UC Berkeley’s Graduate School of Journalism, where she focused on data journalism and writing. She is also a graduate of the Lede data journalism program at Columbia University in New York. Her primary coding language is Python, but R is her first love.
-
Matt Rocheleau
Matt Rocheleau is an editor overseeing data and investigative projects for the Times Union and Hearst Connecticut Media Group. He previously worked for a decade as a reporter for The Boston Globe, where he was a member of the Spotlight Team and led a project that won the 2021 Pulitzer Prize in Investigative Reporting.


