Features:
How We Found New Patterns in LA’s Homeless Arrest Data
Also, Excel files have a secret identity.

The stats are simple: Arrests in the city of Los Angeles have gone down 15% since 2011, but arrests of homeless people have gone up 31%. By far the top charges have been for non-violent or minor offenses; these make up the majority of the charges cited in homeless arrests.
There you have it—the data portion of our recent front-page Los Angeles Times story about homeless arrests, in two sentences.
Why, then, did this story take so many months (on and off, more than a year) to report?
This is not a “how we crunched the numbers” post. You can read about that exercise—and even replicate it—in our GitHub repo here. Instead, I’ll tell you all about how we got the numbers, how we vetted the numbers, and, most importantly, how we found the story behind—and beyond—the numbers. It’s the more complicated behind-the-scenes story, but it’s also (I hope) the more interesting one, because the data itself can only take you so far.
Here’s what happened.
Automating Data Extraction
It all started back in 2009, when Ben Welsh, the L.A. Times data editor, built a Django app to collect daily arrest logs from the Los Angeles Police Department. These arrest logs had been sent to an email distribution list (including the Times) each day by somebody at the LAPD, in the form of text file attachments that contained information about the previous day’s arrestees. Ben wrote some Python code to automate the process of extracting the data, which included arrestees’ names, addresses, charges, and other details, from these attachments and used Django to get it into a searchable interface that Times reporters could easily navigate.
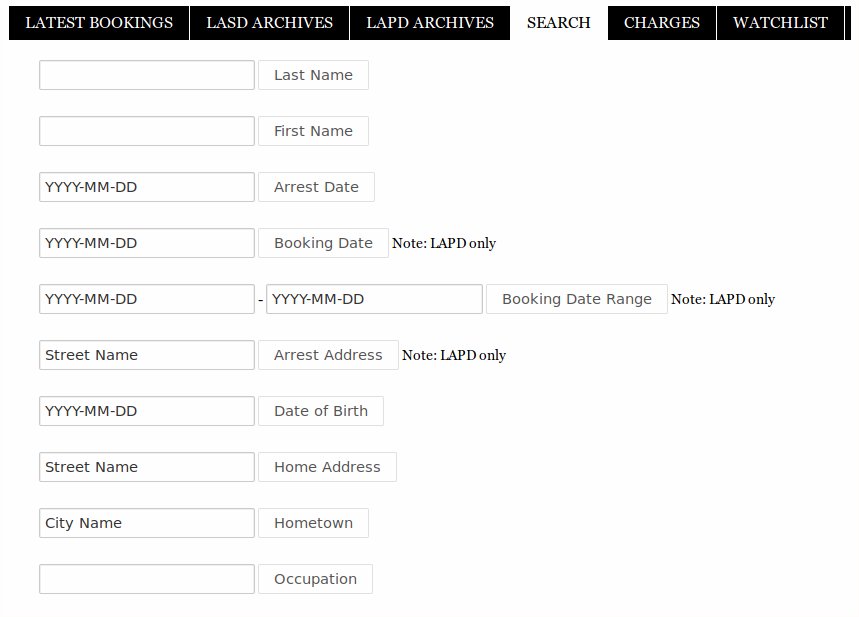
The L.A. Times internal database of LAPD arrests. The Times does not publish this externally as it contains arrestees’ names and home addresses, but you can contact the LAPD to get on the email list to receive the arrest logs, which are public record.
The arrests database helped reporters get ahead of some important stories. Like this one from 2011, about a brutal beating in Dodger Stadium that left a man with brain damage. After failing to link their original prime suspect to the crime, the LAPD made a second round of arrests. Using the database, Times reporters were able to identify and provide details about additional suspects who were taken into custody—information that police were slow to release due to scrutiny they had received over their initial handling of this high-profile case.
By the time I started as an OpenNews Fellow with the L.A. Times Data Desk in the spring of 2016, several years’ worth of LAPD arrests had been collected. It was a good time to start thinking about some overall patterns in the data.
Looking for Meaning
For me, it can be pretty hard (and unproductive) to blindly search for meaning in a big chunk of data. Luckily, Gale Holland, who covers homelessness and poverty for the L.A. Times, had an idea. Gale had previously discovered that L.A.’s law enforcement officers, when arresting somebody who is homeless, will record that person’s home address as “1942 Transient.” (“Transient” has been commonly used in law enforcement to refer to people who do not have a permanent living arrangement, and “1942” is part of L.A.’s Originating Agency Identifier number assigned by California’s Department of Justice.)
The “transient” designation helped to support one of Gale’s earlier stories, a 2014 profile of Annie Moody, a homeless woman who is L.A.’s most arrested person. The database had brought Moody’s name (and homelessness) to her attention, providing the initial lead for the story; Gale was later able to source the figures cited in the story directly from the LAPD.
Gale had been hearing from various sources that law enforcement had been taking a tougher stance toward L.A.’s homeless. In particular, she had heard that enforcement around certain “quality-of-life” offenses, like sleeping on the sidewalk during prohibited hours, was tightening.
To look into this, I queried the database for arrestees with home addresses listed as “1942 Transient,” as well as for some charge codes representing “quality-of-life” violations, like “41.18d” for sleeping on the sidewalk at the wrong time.
During my data analysis, which I did using the tidyverse set of tools in R, I soon realized two things. First, that “1942 Transient” was too limited a filter to apply to the home address field. Because officers record each arrest manually, there can be a number of spelling and other inconsistencies during data entry.
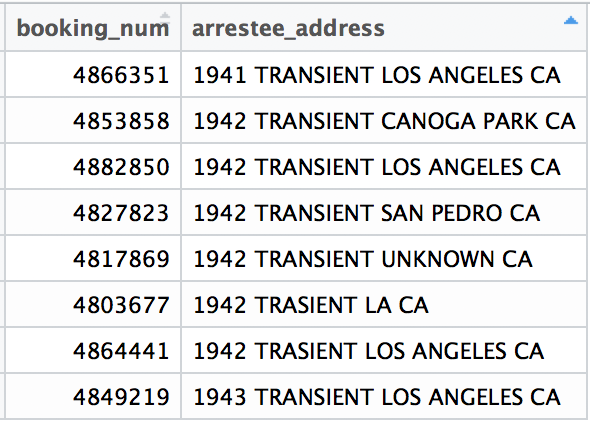
Some of the ways the home addresses of “transients” were recorded.
To keep things simple, I dropped “1942” from the filter and created an indicator variable, homeless, that would be coded 1 if the arrestee’s home address was recorded as either “transient” or “trasient” (the most common misspelling in the data), and 0 otherwise.
data$homeless <- ifelse(grepl("transient", data$arrestee_address, ignore.case=TRUE) |
grepl("trasient", data$arrestee_address, ignore.case = TRUE), 1, 0)
For more about the validity of “transient” as a proxy for homelessness, read the story.
Now that I had a categorization of “homeless” in the data, I could uncover some time trends for homeless versus non-homeless arrests. I found out that while overall arrests in Los Angeles were decreasing, arrests of homeless people were increasing, both in number and as a percentage of total arrests. In fact, the highest number of homeless arrests “on record” (i.e., going back to 2011 since records were spotty in prior years) was in January 2016, with 1254 arrests (that figure has since been surpassed by September 2016, which had 1273 arrests of homeless people).
I thought that this was pretty interesting, statistically speaking. But as Gale pointed out during the Feb. 8 OpenNews Community Call, journalistically speaking, what matters more is what homeless people were being arrested for. If they were being arrested for violent crimes, for instance, then an increase in arrests would simply be a story of the police doing their jobs. Noteworthy, perhaps, but not exactly front-page news.
Which takes me to my second finding, that the codes we had identified as “quality-of-life” violations were not showing up in any significant way in the data, whether for homeless or non-homeless arrests. Instead, the most commonly cited offense for homeless people was “853.7PC” or failing to appear in court for an unpaid ticket, during every year of our analysis period. In 2016, the most recent year of our analysis, “853.7PC” showed up 21% of the time (in non-homeless arrests, “853.7PC” was the second most commonly cited offense in 2016 after “23152(A)VC” or DUI, but it only showed up 8% of the time). Note we later grouped charge codes for failure to appear and certain other offenses, as described here.
What exactly does it mean for a homeless person to be arrested for “failure to appear”?
Talking to the People
Unraveling the answer to this question took many, many conversations over weeks and months of reporting.
We talked to homeless people who had received citations (aka tickets, not arrests) for violating “quality-of-life” laws like sleeping on the sidewalk, or charge code “41.18d.”
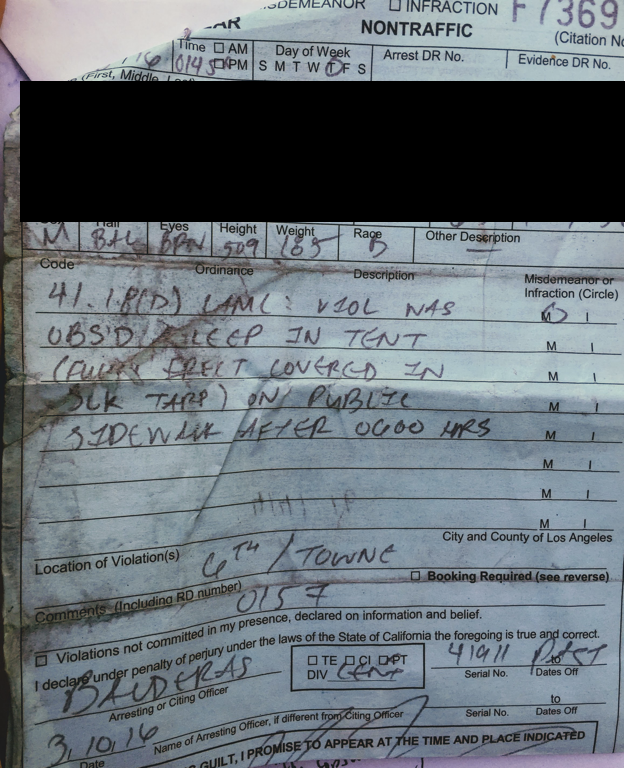
Ticket received by a homeless man in 2016 for violating L.A. Municipal Code “41.18d,” or sleeping on the sidewalk. Personal information blacked out.
It puzzled us to see that hundreds of dollars in fines had been attached to some of these tickets, especially since the nominal fee for “quality-of-life” violations is typically less than $100; for “41.18d” it’s just $35.
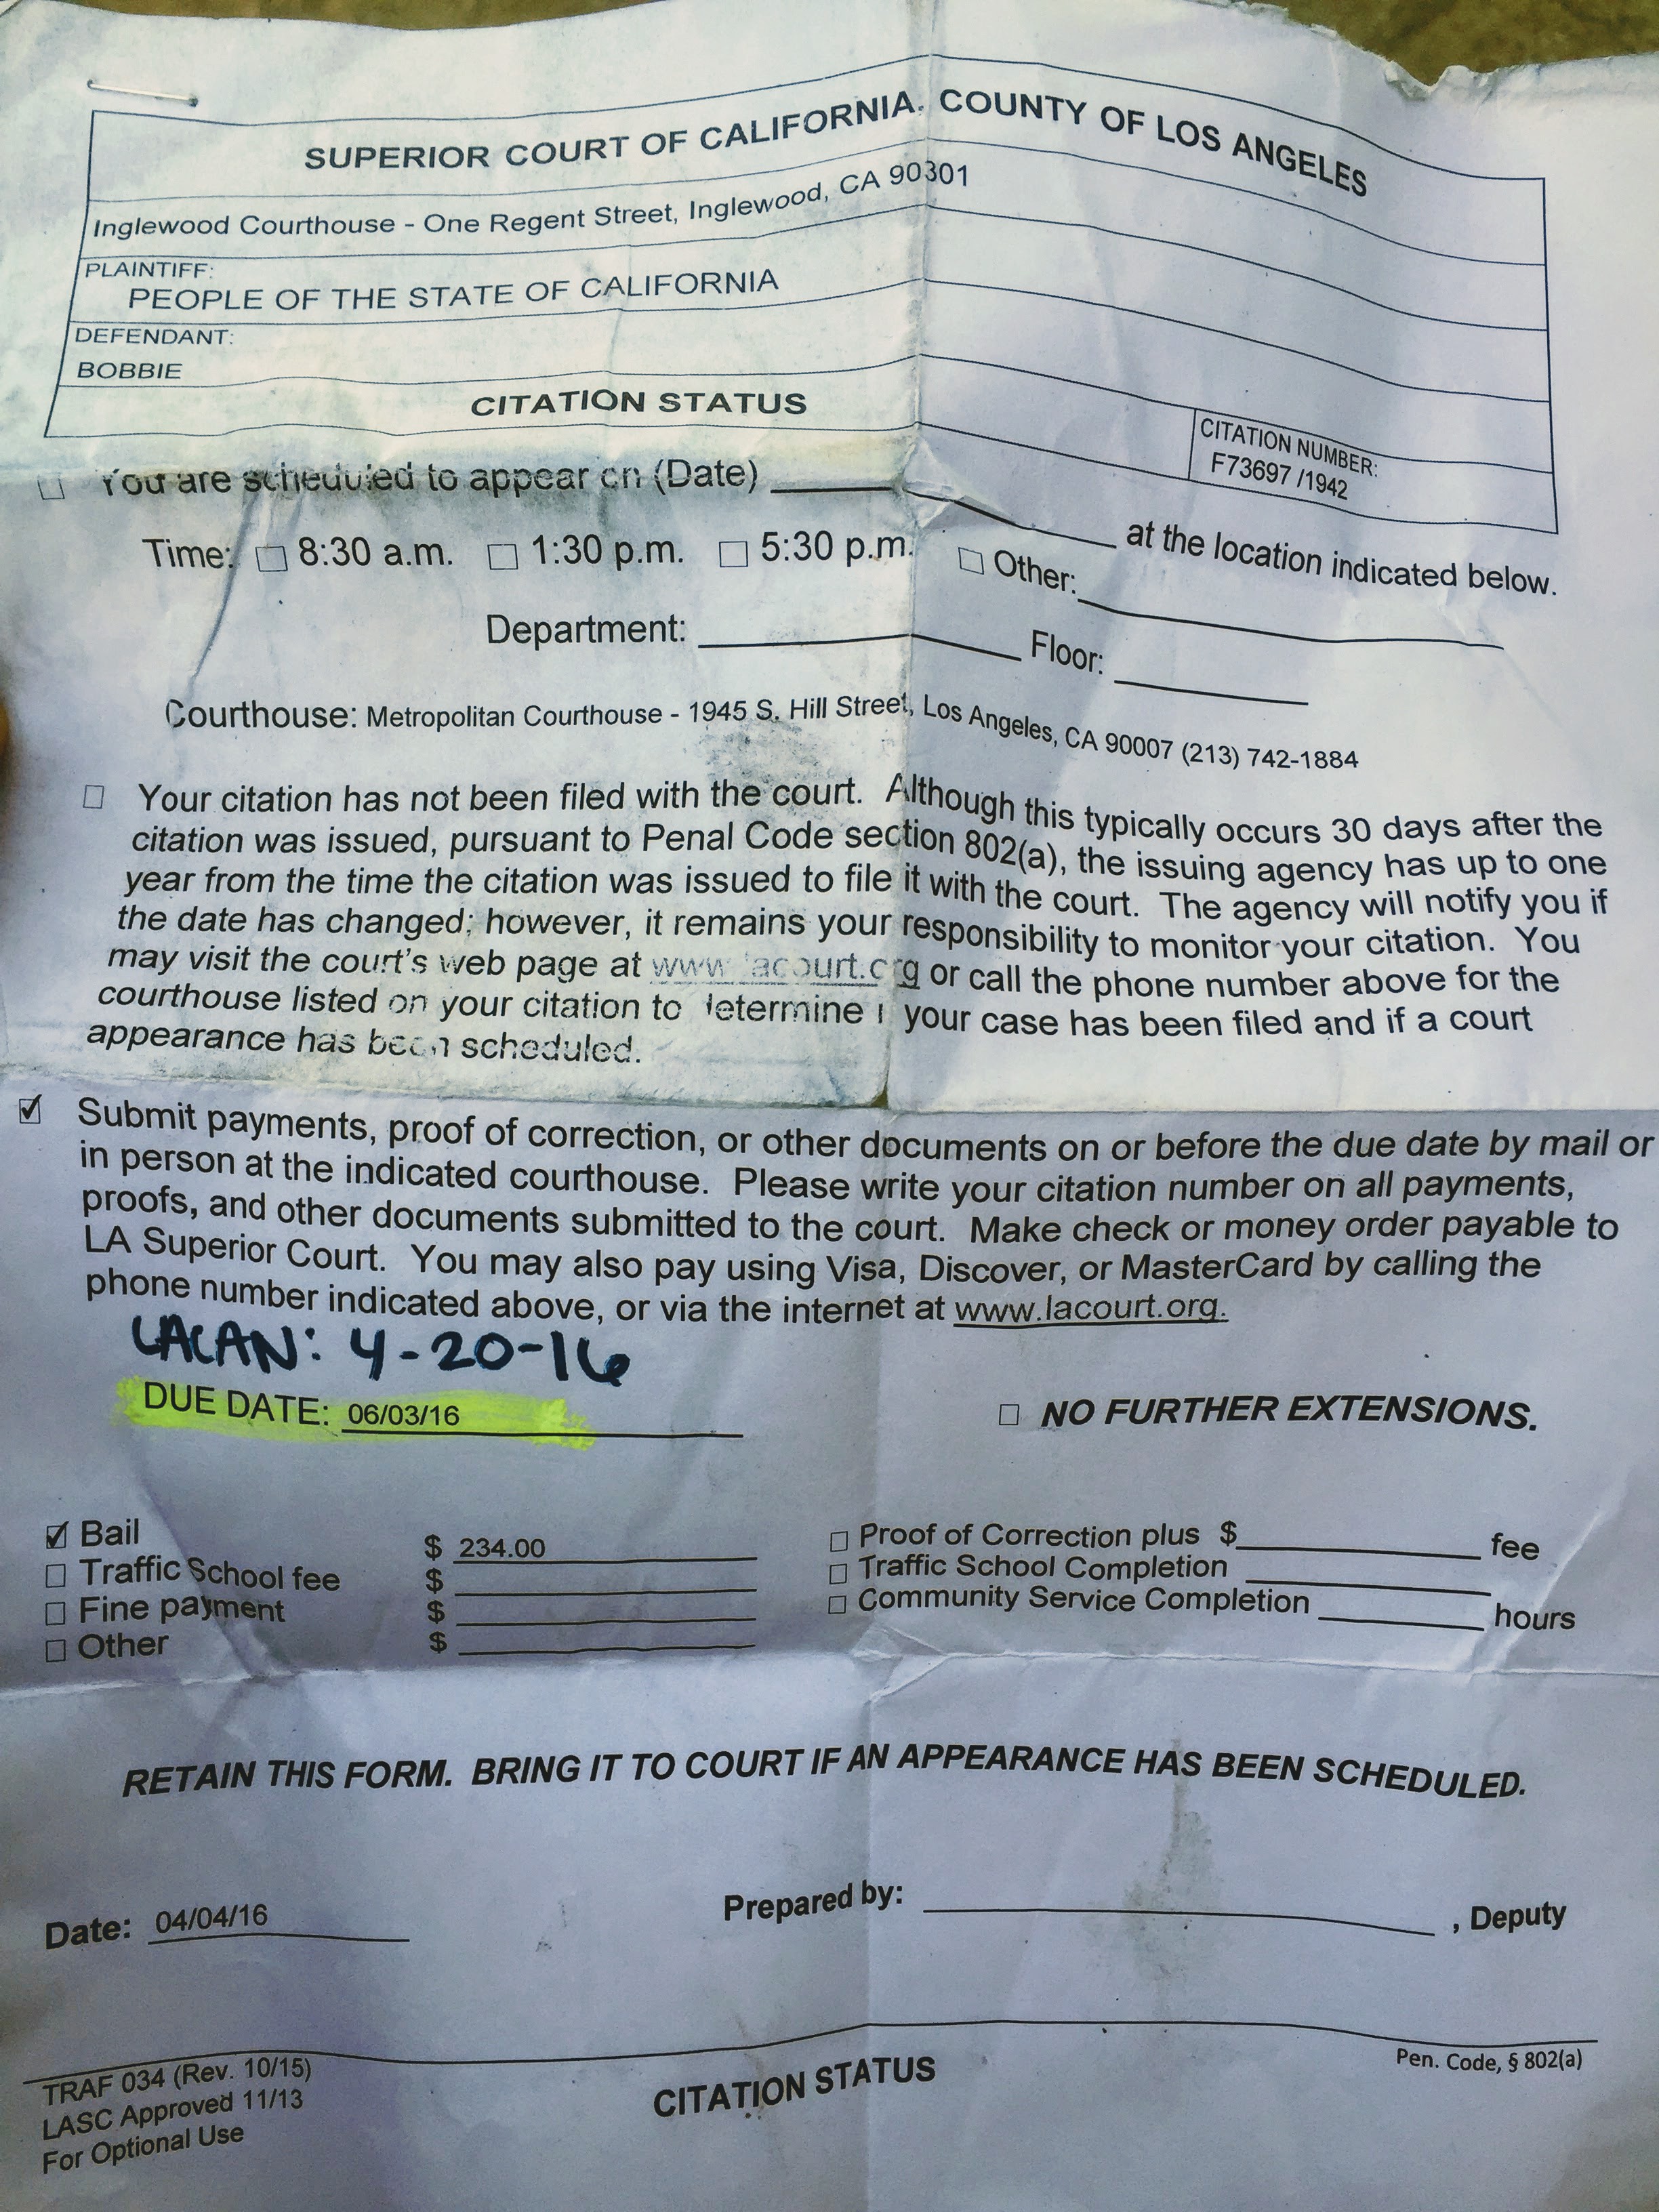
For this homeless man, the total charge for violating “41.18d,” sleeping on the sidewalk, was $234, despite the base fee being $35.
We asked legal advocates for answers; they said that the courts could tack on extra surcharges to the base fee. With no small effort, Gale was able to verify the composition of fees and surcharges with the Los Angeles Superior Court, which you can find as a bar chart in the story, showing how a $35 base fee can grow to more than $200 in total charges.
When homeless people don’t pay the fine, and miss the deadline to appear in court, they are automatically issued a bench warrant for their arrest. And the next time they encounter a law enforcement officer—which is likely to be soon, considering the substantial police presence in and around homeless encampments like Skid Row—they can be arrested, after which they are either taken to jail for a day or two or are released at court, sometimes without even seeing a lawyer.
Essentially, what we had found in the database was not increased arrests for “quality-of-life” offenses, but rather increased arrests for failing to pay or show up in court to face tickets, many of which homeless people, advocates, and lawyers said were issued for “quality-of-life” offenses. If we had only looked at the data without talking to people, we would never have uncovered this key insight. Like I said, the data itself could only take us so far.
About Those Missing Pieces
Even though the broad outlines of the story were coming together, there was still a lot left to do. Gale worked on determining and confirming what exactly happens to homeless people after they are arrested, navigating what we call in our story “a maze of courthouses and systems,” and reconciling some conflicting reports from the LAPD. Meanwhile, there were a couple of data hurdles I had yet to overcome. One was the problem of missing data. Although the LAPD emails with the arrest logs are supposed to be sent daily, some of them had never been sent at all, leading to an incomplete database on our end; all in all, we were missing more than 50 days. After exercising my persistent emailing and “picking up the phone” skills, I finally received all of the missing arrest logs from the LAPD, except for the logs from six days in 2011, which I was told were stuck on magnetic “data tapes” (!). Rather than going down that rabbit hole, we decided to pro-rate the 2011 arrest figures, meaning we assumed the distribution of homeless and non-homeless arrests was proportionally the same during those six days as it was during the rest of that year. Since we had just a few missing days, we thought this was a valid workaround.
A much bigger problem was that starting in October 2016, the LAPD decided to send us their arrest logs as Excel files rather than text files. This was the result of an effort to “modernize reporting” by using an automated system to distribute the logs, rather than having somebody manually email them each day (ironically, this was also meant to be a solution to any future “missing data” problems, since a machine would never forget to click “send,” unlike a human). Unfortunately for me, an inexperienced Python user at the time, this meant re-examining Ben’s original Python code for parsing text files from email attachments and finding a way to make it work with Excel.
Still more unfortunate was the fact that the only Python command I knew of for programmatically reading Excel files, pd.read_excel() from the Pandas package, did not work on these particular Excel files, resulting in the following error, which meant nothing to me at first:
XLRDError: ZIP file contents not a known type of workbook
In my desperation, I turned to R, but readxl from the trusty tidyverse also let me down:
Error in read_fun(path = path, sheet = sheet, limits = limits, shim = shim,  :
Couldn't find 'xl/workbook.xml' in 'email_attachment.xlsx'
I even asked (begged) the LAPD to change the file type back to text files, or to send CSV files instead, but to no avail.
Of course, I could have manually opened each Excel file and saved it as a .csv or .txt file myself, but that was one option I never seriously considered, as it would have been far more rewarding, not to mention sustainable, to find a programmatic solution.
Ben suggested I look into the GitHub repo for the xlrd package, which Pandas uses to read Excel files. “It’s not magic; it’s code,” he said to me, perhaps indirectly channeling Brian Boyer. “You just have to figure out how it’s parsing the Excel files, and why it’s not working in this case.”
The Truth about Excel Files
It took me an embarrassingly long time and a lot of running and re-running some truly terrible test code, but I eventually discovered the truth about Excel files…they’re secretly ZIP files! See for yourself: rename an Excel file from .xls or .xlsx to .zip and unzip it. Here’s what the contents should be, courtesy of Brian Smith:
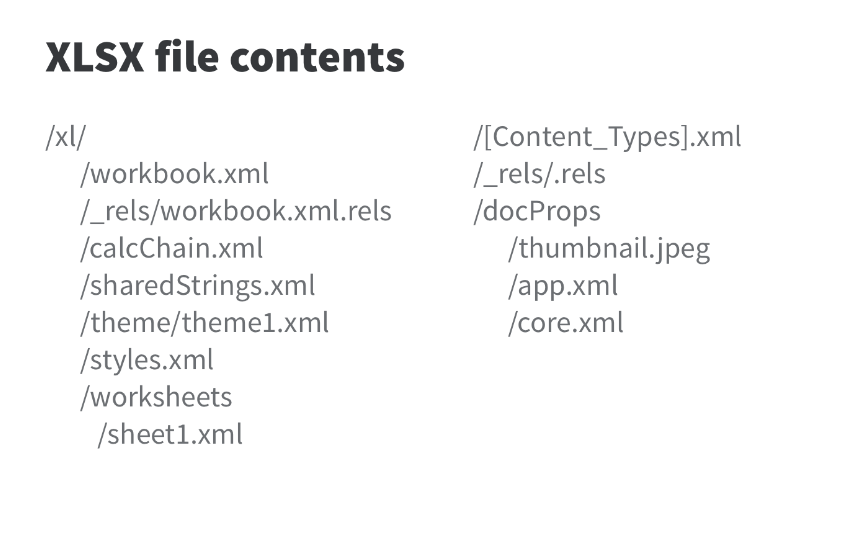
Contents of a normal .xlsx file. Slide from Brian Smith’s excellent 2016 csv,conf,v2 talk, “What we can learn from XLSX,” which I wish I had discovered at the start of my Excel adventure rather than after the fact.
The most important file here is “sheet1.xml” since it contains the actual data. xlrd and other Excel parsers essentially work by unzipping the Excel/ZIP file, parsing the “sheet1.xml” file, and using some of the other files to figure out variable types and other metadata.
The problem was, unlike normal Excel files, these LAPD Excel files were not structured in a way that xlrd or any other Excel parser was used to. The parsers were all expecting “sheet1.xml” to be inside of a subfolder called “xl”. Hence R’s error message, “Couldn’t find ‘xl/workbook.xml’ … ”
Instead, in the LAPD Excel email attachment, the “sheet1.xml” file was in the main folder, while the “xl” subfolder was nowhere to be found:
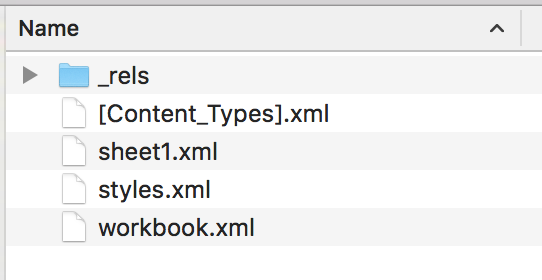
Contents of the .xlsx file that was sent as an email attachment by the LAPD. Not your normal .xlsx file.
Weird, right? Is this just a quirk of the LAPD automated report-generating system, or is it a larger issue with programmatic Excel parsers? An interesting philosophical question, but I didn’t really have time to find out—we had a story to finish, after all.
So I did a hacky thing. I treated “sheet1.xml” as if it were xml code on any old webpage that I needed to scrape tabular data from. I used the BeautifulSoup library in Python* to do it:
This (finally) got me all of the data we needed for the story. One additional complication was that the new arrest logs only reported up to three charges per arrestee, rather than an unlimited number of charges. This was not a huge deal, since most people had been booked on fewer than three charges. However, it did mean that we made the decision not to use data from 2017 for our story, as 2016 marked the last full year with consistent data.
More to Explore
The stats may have been simple, but the story was decidedly not. As I learned during my time working on this piece with Gale and Ben, even the most straightforward-sounding analysis can have hidden depths and complications. There is always a “story behind the story,” and the most interesting ones behind data stories are rarely all about statistical sophistication.
There are still many stories about homeless arrests we have not yet explored, like additional details about the demographics of arrestees, or how quickly homeless arrests have grown relative to the homeless population. (The city’s stats suggest that arrests have outpaced population growth, though counting the homeless is a complicated exercise, too.) We encourage you to explore the data for yourself (the file is in the feather format for optimal Python-R interoperability; Simon Willison has converted it to a CSV and an interactive SQLite database for online browsing). Take a look, and let us know what you find.
* Special thanks to Casey Miller for her Python expertise.
Also check out the Reddit AMA about this piece.
Credits
-
 Christine Zhang
Christine Zhang is a journalist and data analyst currently based in New York City. She loves stats, stories, spreadsheets, and sandwiches. Christine was a 2016 Knight-Mozilla OpenNews Fellow at the Los Angeles Times Data Desk and has previously worked at the Brookings Institution in Washington, D.C. Follow her @christinezhang.


