Features:
Jessica Lord on sheetsee.js
A Code for America fellow breaks down her data visualization mashup
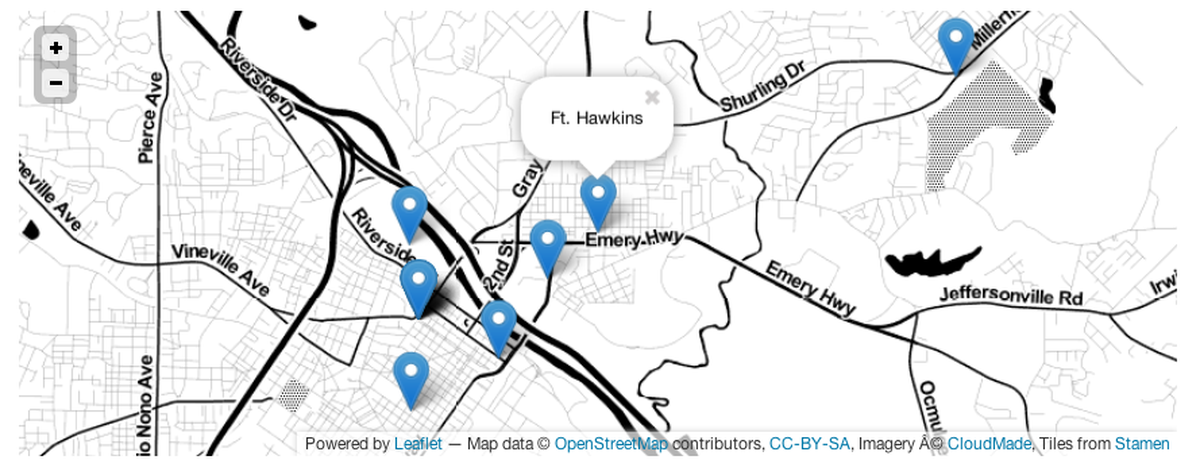
An example project using sheetsee.js.
Jessica Lord’s sheetsee.js mashes up JavaScript to make it easy to map and visualize data from a Google Spreadsheet. Lord, who is a Code for America 2012 fellow, civic data wranger, and lightweight technology enthusiast, agreed to take us into the guts of sheetsee’s development.
Source: Tell us about sheetsee. What does it let us do that we couldn’t do before?
JL: Sheetsee is a JavaScript library mashup. It lets you visualize, map and organize data from a Google Spreadsheet as content on a website.
Source: Why did you need to make sheetsee? (What was the gap that you needed to fill, that wasn’t being filled by existing tools?)
I wanted to create a website for a city department that could be managed by those in the department themselves and not become yet another thing on the IT department’s to-do list. City IT departments are usually spread pretty thin which makes maintaining a department’s site difficult for both IT and the department. Tabletop, a crucial part of the project, is a library that takes a Google Spreadsheet’s data and makes it ready to use for websites but it kind of leaves you hanging after it hands you the data—I wanted to explore the, “Ok, so now I’ve got this data, what can I do with it?”
Source: How did you make it? (Technologies, but also the shape of your process.)
JL: I made it as a component of a larger project, See Penny Work, a project budget visualization tool for cities. The project needed to be lightweight, open source and easy to pick up and use. Half of it is a theme I created in WordPress, starting from the “naked” Starkers theme. Sheetsee is the JavaScript inside each page template that controls the visualizations. I’m basically expanding on tabletop.js, which is amazing and the core of all this working at all. I wanted to take it, add some budget related functions and other useful mapping, charting and templating libraries (Leaflet, Raphaël and mustache.js respectively) so that all the data dependent elements are controlled from a spreadsheet.
The project is my Code for America fellowship project and was done in a lot of coffee shops and with a lot of episodes of Law and Order classic streaming in the background when I worked at home or the office. I learned JavaScript this year thanks to the patience of 2011 Code for America fellow Max Ogden, and when I had questions about php or Wordpress, someone at the CfA office usually had a solution.
Source: Did you hit any interesting snags in the development process?
JL: Since the start of the project I had a vague idea of how the visualizations would be handled, meaning for a while I just said, “and them some JavaScript.” I did everything else in the project that I could before crossing the bridge to really figure out how to pull it off. But the solution is what sheetsee became and is now the most interesting part of the project to me.
Source: I love this, from the readme: “Think of it as a super simple CMS.” What kind of projects would be able to run on just Google Spreadsheets + sheetsee?
JL: So many things! I’m excited every time I think of another situation and am eager to get some time to flesh some of them out. It’s useful in a city-budget-department-maintainable way like I’m using it in my CfA project, but it’s also useful in any situation where you want to, for lack of a better phrase, “set it and forget it.” Once you have a website designed and sheetsee plugged in you can essentially just manage the content through the spreadsheet. You can share the link to that spreadsheet and easily add collaborators, edits are made at every auto-save.
Imagine a neighborhood or block keeping a spreadsheet of tools residents owned and if it was being borrowed. Neighbors could add items or add their name to a checked-out-to-column if they’re borrowing. Then when you went to the website you’d see an up-to-date inventory of what’s available and where. Another interesting use is to pair it with iftt.com which will fill up spreadsheets with all kinds of data. Anything you can get iftt.com to send to a spreadsheet you can hook into a website and not even have to enter in new information yourself because iftt.com is doing it for you. I’m playing around with that now with my Instagram and Pocket feeds. Oh, and since you can get Google Forms to feed into a spreadsheet, you could imagine journalists polling residents and having those results directly tied to maps or charts in an online news story. I’ve never been so excited about spreadsheets before!
Source: You developed sheetsee as part of your CfA fellowship…and I know you’re wrapping up documentation and setup information by November 16th. Where do you imagine sheetsee going after mid-November?
JL: Right now it was developed alongside of my project for Macon, Georgia and tailored for that instance. After the fellowship ends in November I would love to spend more time cleaning it up, making it more generic, giving it better charts and graphs out of the box and making it easier to set up for non-developers.
Source: What kind of help could you use from the news development community?
JL: I’d love see it used and see the ways in which it was used. It would also be great to get contributions of functions or other libraries that people have found useful. For instance, right now I’m using Raphael.js for the charts because in my CfA project for the City of Macon it was important to consider IE6+, but I’d love to see some easy-to-dump-data-into D3 charts.
Source: Anything else should we know?
JL: Not that I can think of. But if people have questions or ideas feel free to let me know! @jllord or jessica@codeforamerica.org.
Credits
-
 Erin Kissane
Editor, Source, 2012-2018.


