Features:
How We Made “Rewind the Red Planet”
Telling the story of a planet, on a human scale

The mini-series Mars, that aired on the National Geographic Channel in November 2016, imagined what it would be like to live on Mars in the near future. For the interactive narrative Rewind the Red Planet, we endeavored to show Mars as it was before it was a red desert, back to a time when liquid water may have run freely, between three and four billion years ago. We wanted to allow readers to see ancient Mars in its entirety from a planetary scale—and how it may have featured a vast northern ocean, or may have had water trapped in expansive glaciers.
We also wanted to continue the story from the global scale to a more human scale, and depict what it would have looked like to stand on Mars so long ago, compared to today. Gale Crater, the site of the Curiosity rover landing in 2012, would serve as a somewhat familiar starting point for readers to experience this as a 360° panorama, draggable on a desktop and gyroscopically controlled on a phone.
To make all this happen we used WebGL, and so this project was my first serious journey into the world of 3D in the browser using three.js. I’ll walk you through what went into constructing it from a development perspective, including rendering geospatial imagery and text on a globe. I’ll also discuss the usability and performance challenges inherent in creating scroll-driven 3D graphics that perform well.
Depicting Modern Mars
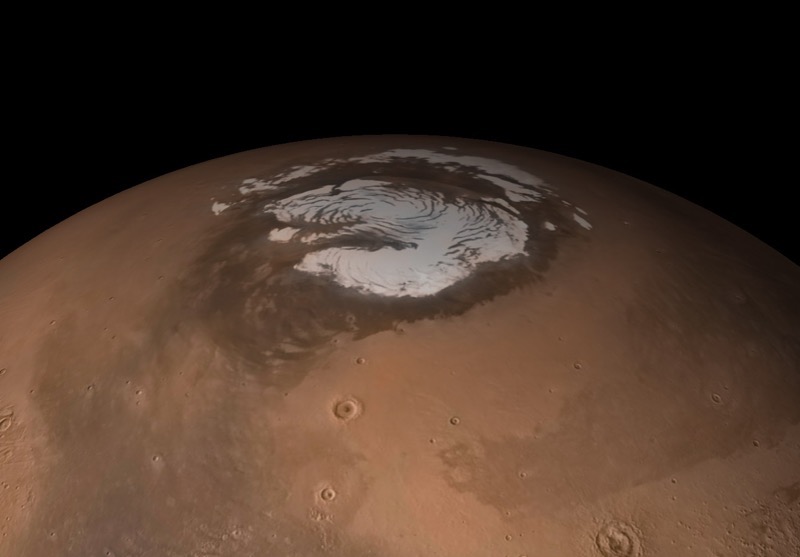
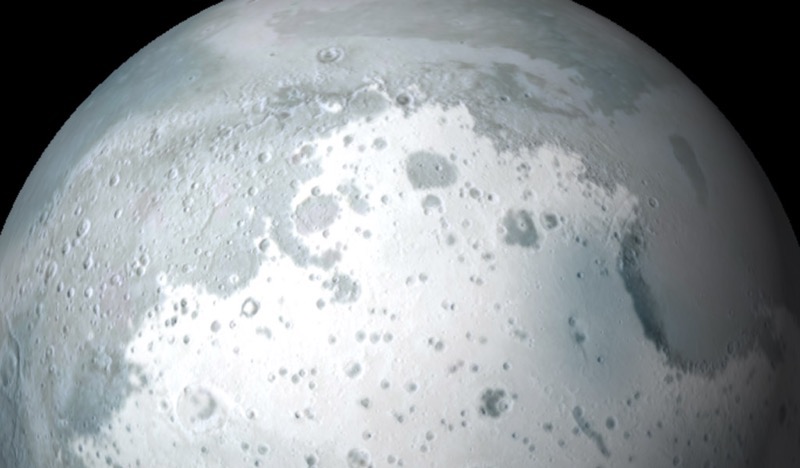
Our story begins in outer space, with a view of Mars’ north pole as a 3D globe. To lessen distortion, this globe was created by mapping imagery to a cube, and then inflating the cube to a sphere.
Before finding the cube technique, I tried a more straightforward approach, using three.js to render a sphere, and wrapping imagery around it. My first attempt can be seen below, left.
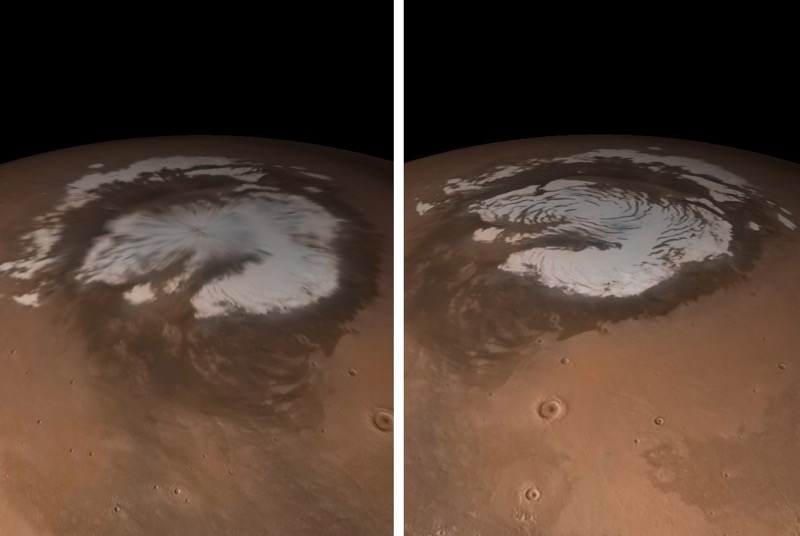
Mars imagery rendered as a sphere. Left, using imagery wrapped around a sphere with polar pinch. Right, using the cube inflation technique without polar distortion.
If you look closely at the pole, you’ll notice how the imagery is pinched at the center of the ice cap, which is not an uncommon sight in 3D interactive globes.
For the renders above, you’re looking at imagery of Mars produced by cartographer and senior graphics editor Matt Chwastyk, which was originally featured in the November 2016 National Geographic Magazine supplement poster (the map side of which is viewable here). This mosaic, specially prepared for National Geographic, is derived from the Mars Orbital Camera aboard the Mars Global Surveyor (MGS). Matt also enhanced the mosaic by using elevation data from the Mars Orbital Laser Altimeter (MOLA), also aboard the MGS.
To prepare the imagery for the pinched render shown above left, he took the geospatial raster data comprising this image and “unprojected” it to the plate carrée projection (aka, equirectangular or WGS84). This means that latitude and longitude are plotted linearly with X and Y pixel dimensions. These dimensions, when considered in degrees, match the angular dimensions of a sphere: 360 degrees wide, 180 degrees tall.
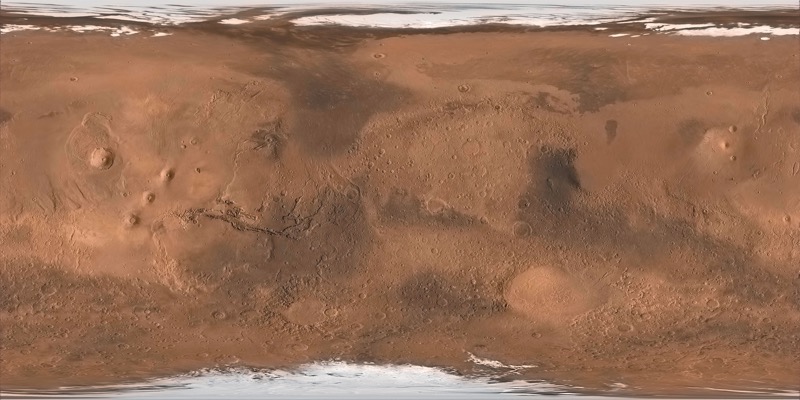
Global mosaic of Mars, plate carrée projection
Plate carrée, different from the Web Mercator projection used in Google Maps and Mapbox maps, introduces severe distortions approaching polar regions, given that polar extents represent smaller areas than the equatorial extents, but they’re stretched to the same width. When this image is wrapped back onto a sphere, it forms a singularity of sorts, the pinching seen above.
To overcome this, I tried a different approach not unfamiliar to the 3D graphics world, called gnomonic cube mapping. Instead of a sphere, I started with a cube, and worked with Matt to prepare six cube faces that “undistort” when inflated to a sphere.
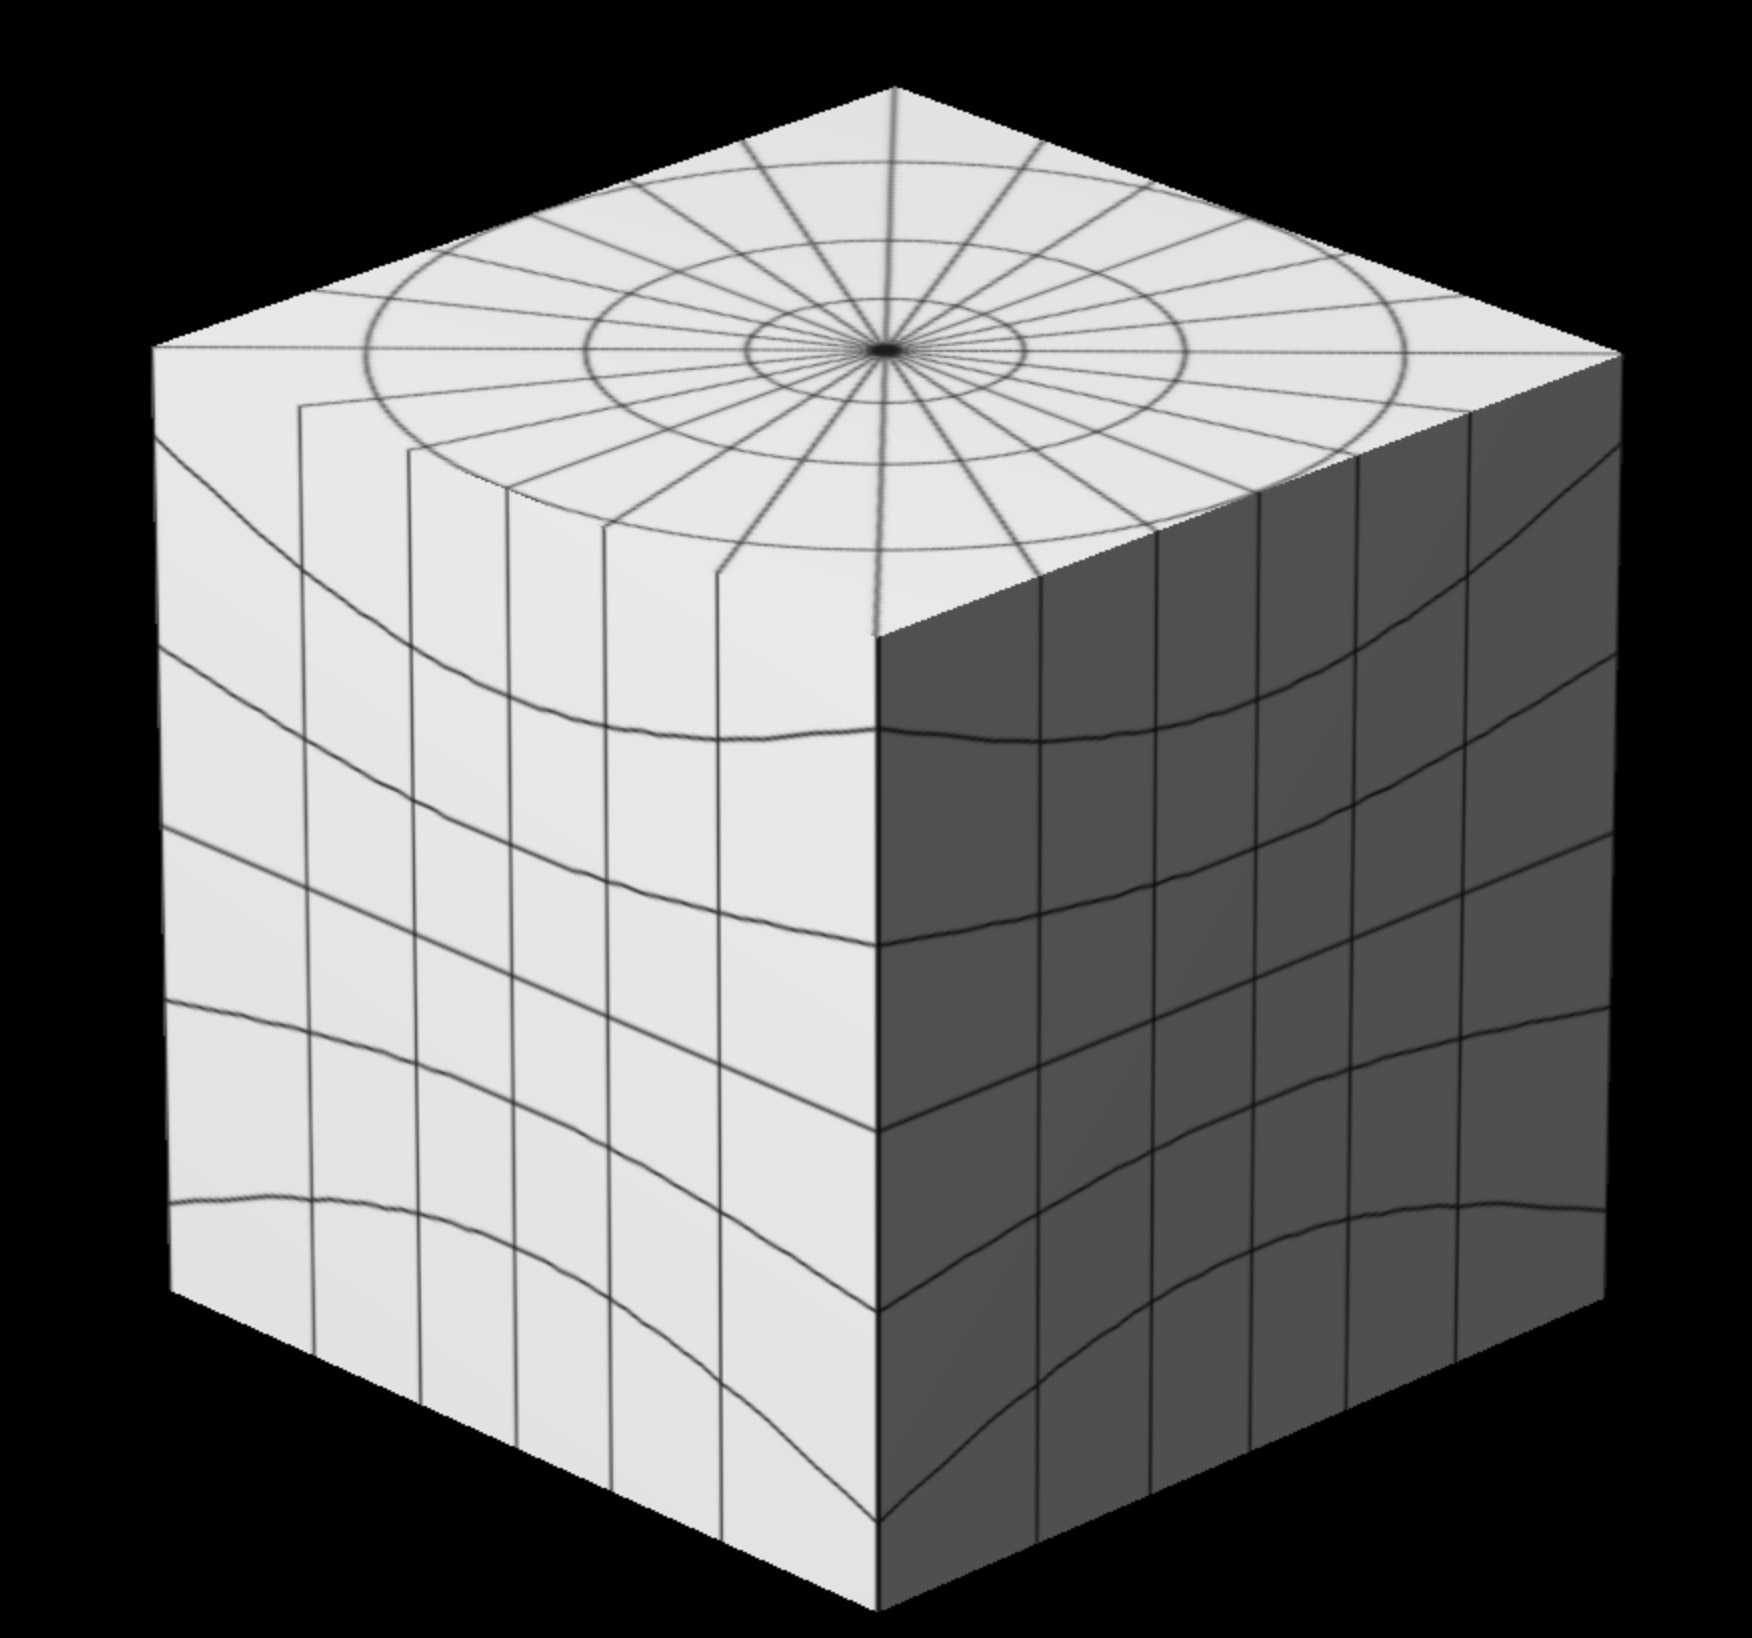
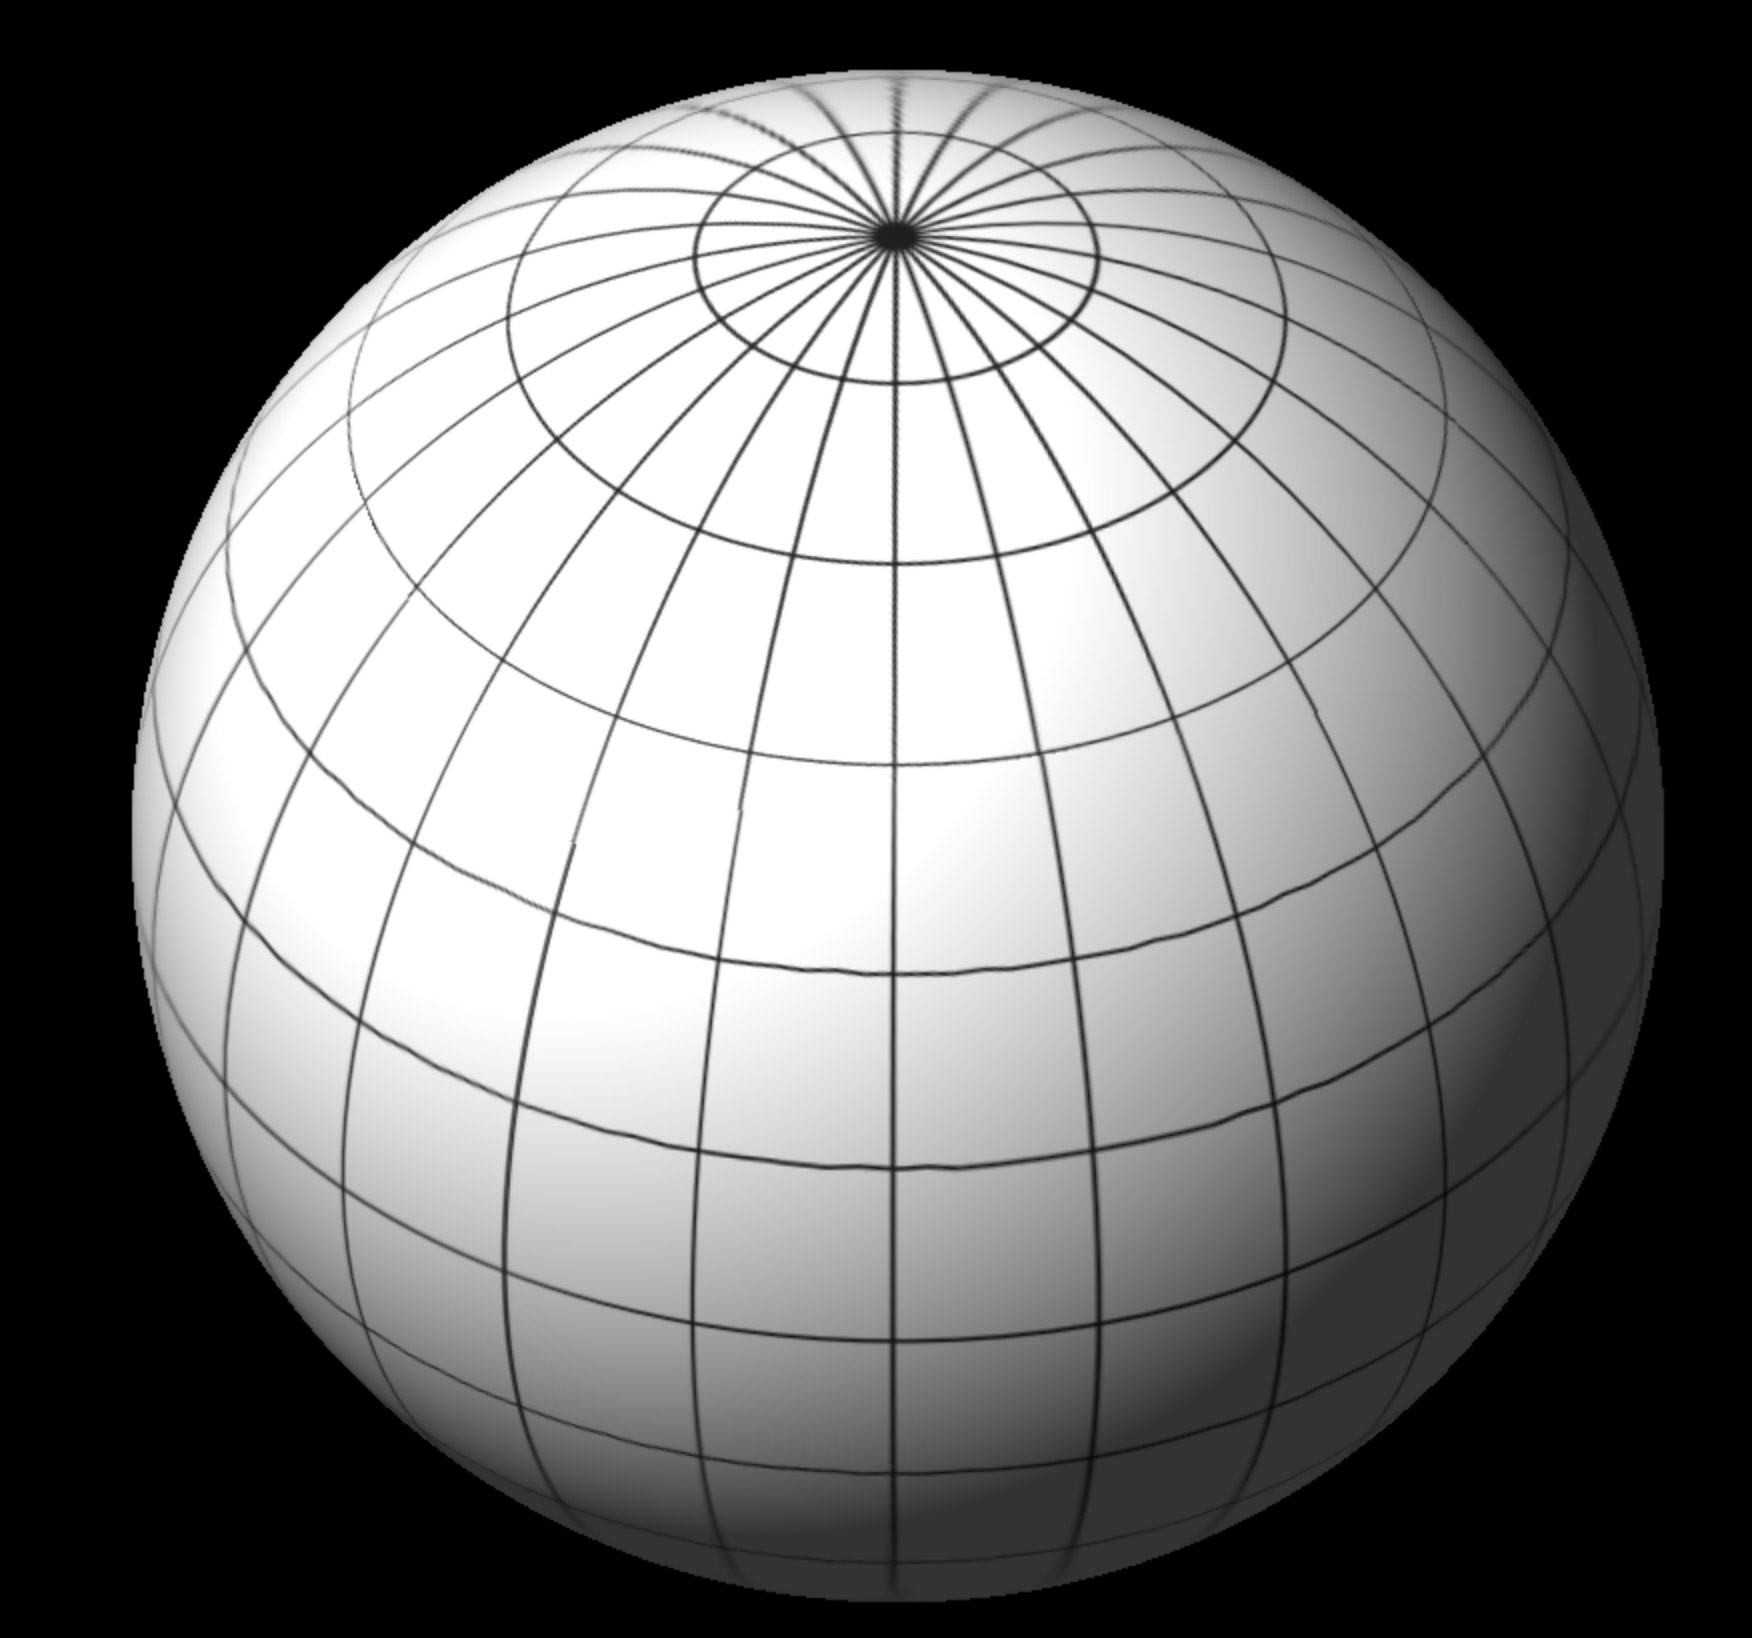
Graticules of the gnomonic cube faces, as a cube, and the same cube inflated to a sphere. Note how the bowing of latitudes inherent to each face’s projection form virtually seamless circles when warped.
Instead of plate carrée, each cube face is prepared with the gnomonic projection, which is most easily described as the view from the center of a planet, looking outward towards a hemisphere. Using ArcGIS and Natural Scene Designer, Matt generated images equidistant around Mars: four horizontal, and two vertical. This projection initially produces circular images, but they’re then clipped to a square that circumscribes a circle covering 90 degrees of land. We’re left with the six images below.
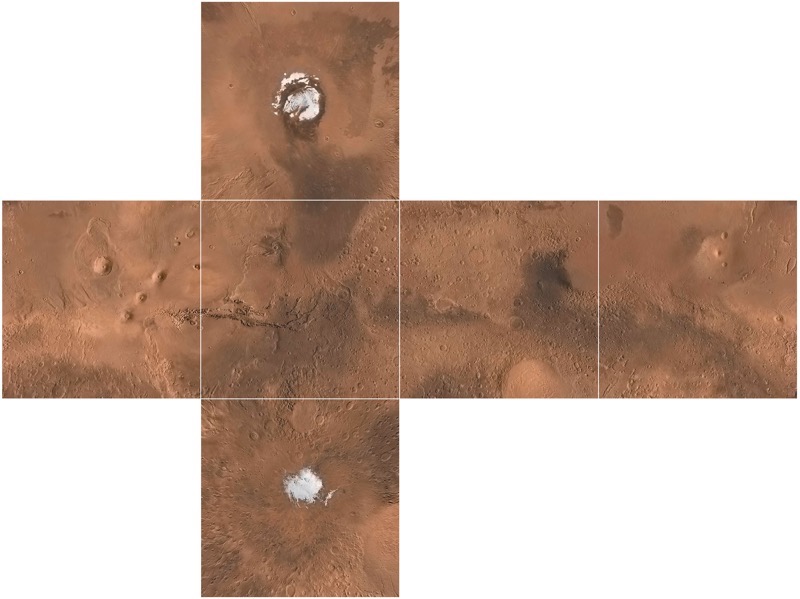
Six gnomonic cube faces clipped around circles with a radius of 45 degrees.
Did you know that Mars is not actually a cube in real life? There’s one more important step. In the world of 3D graphics, all objects are made up of triangles, even flat cube faces. So I subdivided the cube faces into a lot of triangles, so each vertex on the plane can be warped. In this interactive example, you can use the controls in the top right to increase the number of segments, which increases the number of triangles.
This allowed me to perform the magic. I manipulated the mesh comprising the cube, setting each vertex of each triangle to be the same distance from the 3D center, the planet’s core, of the cube. With this “vertex displacement,” the cube becomes a sphere, and because we used the gnomonic projection, the distorted corners of the cube faces inflate outward to become nearly seamless and undistorted, with our poles intact.
View of Mars as a gnomonic cube, inflated to a sphere. Success!
We now can repeat this process for ancient Mars imagery and then manipulate the position, rotation, and opacity of our “cube-spheres” in 3D space according to interactions.
All of our raster layers before being inflated to a sphere. Resistance is futile.
Depicting Ancient Mars
Our depictions of ancient Mars represent an illustration of current scientific interpretation. There’s plenty of evidence for an extensive water presence on Mars, but some speculation as to the extent to which the water was in liquid or ice form when we reach so far back in time, depending on scientific perspective.
So, for our oldest depiction (3.8 billion years ago), we’re showing two possibilities. First, a wet scenario that has been illustrated previously in popular depictions of Mars, with a large northern ocean.
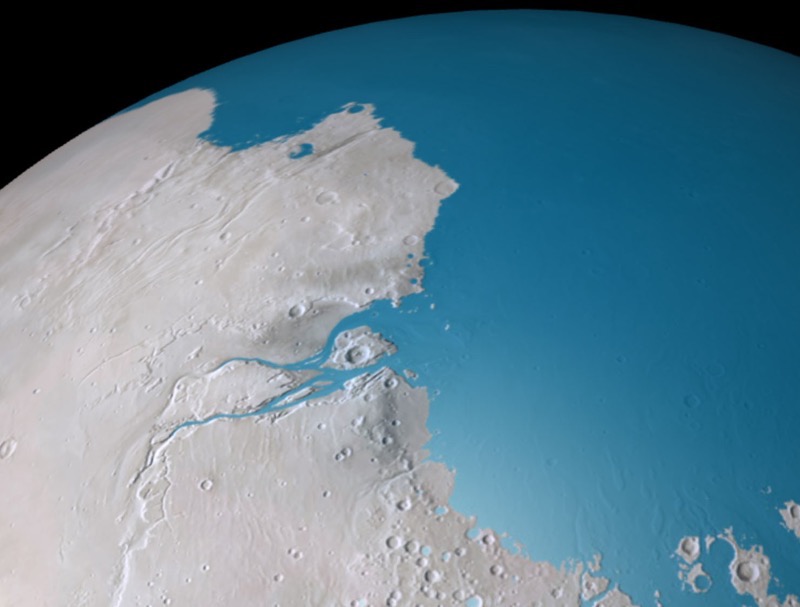
A gray Mars with a northern ocean, representing the wet scenario 3.8 billion years ago.
To start constructing this, Matt started with his modern imagery of a red planet. For simulating ancient conditions, we benefit from plate tectonics on Mars being non-existent. Unlike Earth, topologically speaking from a planetary scale, Mars isn’t terribly different 3.8 billion years ago than it is today, with a few exceptions. This allows us to just modify a modern base of Mars rather than concocting some radical paleogeography.
Atop the base, to form the water layer, Matt used the newly available high-resolution global digital elevation model (DEM) of Mars, from MOLA. Within ArcGIS he queried the dataset to extract a layer that represents areas beneath –2500m altitude. Of course, modern Mars has no oceans, no “sea level”, so elevation is relative to a sphere like-object that best fits the planet (for more on that, see section 4.4).
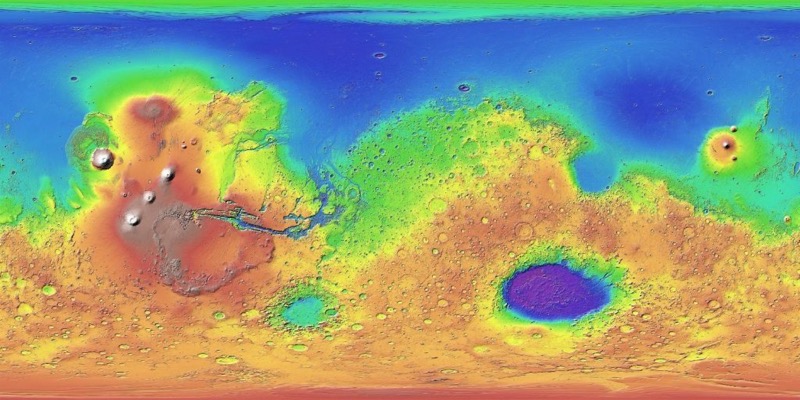
Mars elevation. Mars can be characterized by lower elevations in its northern hemisphere and the “Tharsis Bulge” towards the West. Tharsis is home to Olympus Mons, the tallest volcano in the solar system. Towards the southeast is Hellas Planitia, a massive impact crater. (NASA)
Some trial and error went into figuring out what altitude to use, for water to nestle naturally into what appear to be ancient river deltas. Matt supplements this liquid coverage with lakes scattered between drainage networks and within craters. This lake data was from Caleb Fassett of NASA’s Marshall Space Flight Center and Tim Goudge of The University of Texas at Austin.
A gray Mars covered in snow and ice, representing the icy scenario 3.8 billion years ago.
The other scenario is a more recent interpretation of Mars. We depict an icy mars after consulting with Robin Wordsworth from Harvard University, who does planetary-scale climate modeling of ancient Mars. Robin’s models speak to an icy seasonality of mars, with areas of ice melting episodically to liquid water. This distribution, whether ice appears more at the poles or equator, is largely determined by the chaotically varying axial tilt of Mars. Ultimately Wordsworth’s ice coverage model data was much coarser scale than the DEM we were using, so we didn’t use it directly, but he advised our approach in draping an ice layer. Similar to the water, Matt used the MOLA dataset to create a layer above 1600m, then did a pass on it in Photoshop to give it a less uniform texture.
Rendering 3D Labels in 2D
For the final scene of Mars, we’re depicting landing/crash sites of probes and rovers that we’ve sent to Mars. Dealing with text in WebGL is hard. So rather than rendering text in actual 3D, I opted to render text labels in a 2D SVG, re-mapped to locations floating atop a 3D globe.
Remember the plate carrée projection from my first attempt at wrapping an image around a sphere? While this leads to distortions in raster imagery, it works well as a way to store the point locations that represent text anchors. Longitudes and latitudes (aka, angular coordinates on a sphere) map neatly to X and Y within the image. We can make use of this one-to-one correspondence to simplify the calculations needed to re-map these coordinates to their location within 3D space.
To do this, we first place map labels and markers within Illustrator, using typography in accordance with National Geographic type conventions.
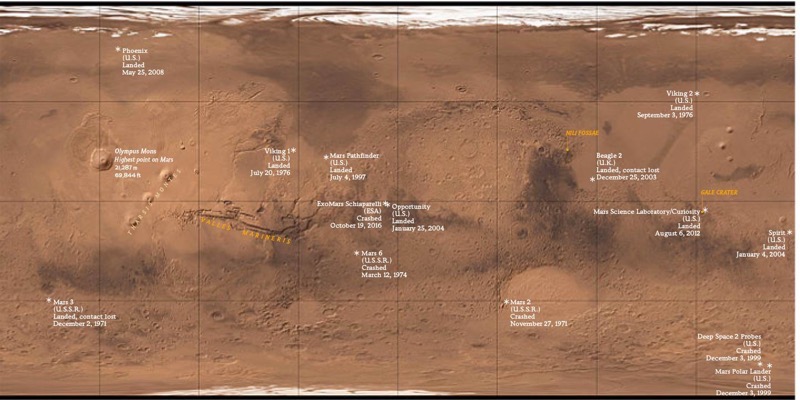
Map labels and markers placed atop a plate carrée Mars mosaic.
From here, we export an SVG from Illustrator of just the labels. SVG is distinct from raster formats like JPEG and PNG in two ways. First, it’s a vector format—it can be freely scaled without distortion. But more importantly for our purposes, when brought into the browser its data can be readily parsed and manipulated. We can directly look up coordinates for text and labels and convert them to their corresponding spherical locations, on the fly. This means that we can use Illustrator as a powerful layout tool (while allowing for things like curved text on a path and kerning) and directly (and quickly) get changes into the browser. While I’ve used ai2html (a really great tool from The New York Times) in the past, it doesn’t respect text on a path, or provide coordinate data in an easily digestible format.
Things now get slightly hairy. I needed to take the 2D SVG coordinates of text labels, scale their corresponding position around a sphere, then convert this back into 2D browser coordinates in order to properly register labels atop the globe.
1) Using JavaScript, after the SVG nodes load into the DOM, I get the X/Y coordinates of text anchors within the SVG and convert these to angular coordinates, which is like latitude/longitude except values are scaled between 0 and 360 instead of –180 and 180:
var longitude = (xSVGPos * (360 / widthSVG))
var latitude = (ySVGPos * (180 / heightSVG))
2) With these coordinates, and knowing the radius of our sphere, I used my rusty high school trigonometry, to calculate an X/Y/Z along the surface of the sphere. We use radians instead of degrees because that’s what JavaScript wants.
var latitudeRadians = latitude * (Math.PI / 180.0);
var longitudeRadians = longitude * (Math.PI / 180.0);

var x = sphereRadius * Math.sin(latRads) * Math.cos(lngRads);
var y = sphereRadius * Math.cos(latRads);
var z = sphereRadius * Math.sin(latRads) * Math.sin(lngRads);
3) We now have locations on a sphere, but where do these locations exist in 2D browser space? Three.js has built-in functions for this. Like most things in my life, the answer comes from StackOverflow.
From here, I recalculate all of this any time Mars gets rotated (as in, the user scrolling) to update text positions relative to a shifted globe.
Setting up the 360° Panorama
To allow readers to experience what it would be like to stand on a modern and ancient Mars, we chose a few dramatic and geologically interesting locations on the planet to be illustrated, as detailed by science editor Victoria Jaggard. We rendered the impact crater Gale Crater as a 360° panorama for a more immersive experience and expansive view. We followed that with static imagery of the valley networks of Nili Fossae, and the mega-Grand Canyon known as Valles Marineris.
Fellow graphics editor Jason Treat worked with illustrator Dana Berry, who consulted with Mars scientist Bethany Ehlmann (of California Institute of Technology) to try to depict Mars with a warmer, wetter landscape. For the 360° panorama, Dana generated this before-after pair in the 3D software Maya and used a plugin called Domemaster to generate “equirectangular” projected images that work as a panorama.
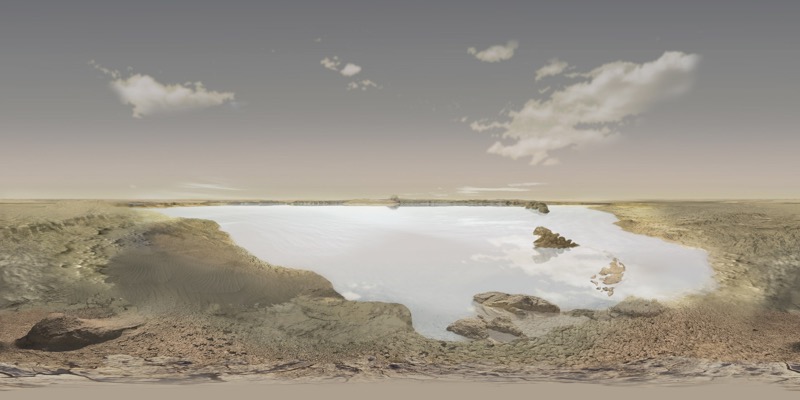
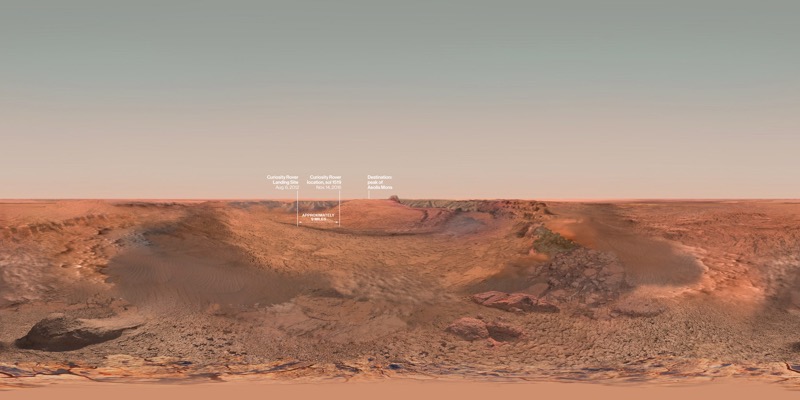
Equirectangular panorama images before being mapped inside a sphere. Top, the Gale Crater 3.5 billion years ago filled with water. Bottom, a render of the Gale Crater today.
An equirectangular image has a lot in common with a plate carrée map, in that spherical imagery is warped to a rectangle along a regular grid, and can be used to wrap onto a virtual sphere. The difference now is that instead of looking at a sphere like a planet, I moved the camera into the center of the sphere and look outwards, mapping the texture to the inside of the sphere. This suffers from the same polar pinching like in the very first example, but I could live with this given the emphasis on central parts of the scene. There are a number of ways to achieve a panorama effect, and, like in the globe, I could have lessened distortion with a cubemap, also known as a skybox in this context. The New York Times has a nice writeup of these techniques in the context of 360 video.
If you visited this interactive on a mobile device, you’ll notice that the panorama is controlled by the phone’s gyroscope. Adding this wasn’t a big lift with three.js. I followed this example, and used this device orientation tracking script that was already written for three.js, and activated it in mobile devices to manipulate the orientation of the three.js camera according to device movement.
The main challenge in entering this section was from a design, narrative, and user experience perspective. We wanted to make it an obvious transition between the planetary view and on-the-ground view, so I set up the globe to finish its rotation centered on the location of the upcoming scene as a visual cue. It was also important that it be clear that the panorama was an interactive element, after transitioning to the on-the-ground perspective.
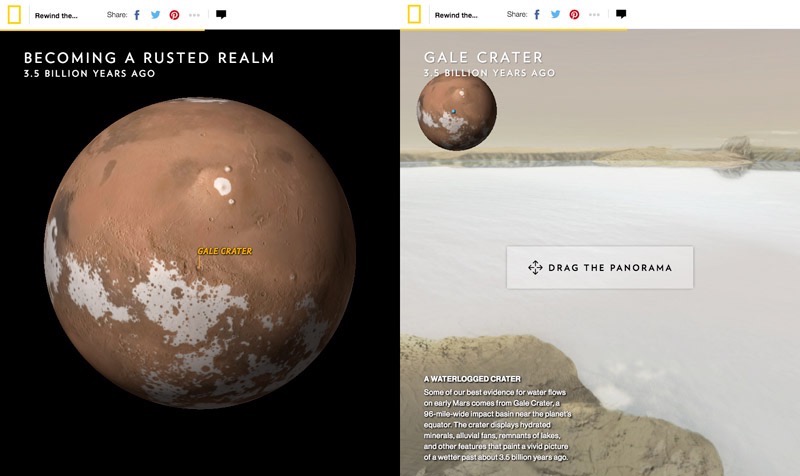
The interactive before (left) and after (right) transitioning to the panorama.
After getting feedback from department directors and other graphics editors, I spent a good amount of time tuning the transition, adjusting the amount of scrolling and the sequence of transitions that occurs: the globe shows a label, stops spinning, shrinks into a locator map size, reveals a panorama, switches titles, and shows a pulsating beacon. With the amount of elements to transition, it helped to reduce the amount of things that were simultaneously animating, to try to focus attention and not overwhelm.
What I think really helped here was the addition of the “Gale Crater” label in the center of the globe before shrinking it. This label was a late-stage addition, a small but important detail that reinforced the connection between the globe and next scene.
Lastly, a fundamental part of even attempting a transition like this was ensuring everything was animating smoothly, which was not always the case with this project. I consider jerkiness and performance hiccups serious UX problems that have to be solved for. While I really like seamless scale transitions—I think they can help a reader stay focused and allow the persistence of visual relationships—I seriously considered a more static transition to prevent distracting and frustrating scroll issues.
Performance Challenges
Rendering high resolution textures of Mars in 3D is a graphically intense thing to do in a web browser, and throughout this project my computer fans were running hot! I took great pains to reduce the computational weight of the experience, to get things working nicely on mobile devices, and as best as possible on older computers.
Performance problems can be a bit like death from a thousand cuts, a cumulative effect of smaller issues. But there were also a few big ones. For a while I was using oversized textures, images of mars that were much larger than ended up needing to render on a globe. Big textures mean a lot more work for the GPU to do.
Another big one has to do with how an HTML5 Canvas—where the WebGL globe gets rendered—gets drawn. Unlike CSS or SVG animation, when I want to animate something within a Canvas, the Canvas has to be fully cleared and then redrawn to simulate movement. Like running a filmstrip in a movie theater, if I run the clearing and redrawing fast enough (ideally at 60 frames per second), brains are tricked to combine single frames into a silky smooth animation. However, there are three things in this project that are competing for maximum performance: the globe, the panorama, and tracking the distance of page scroll. Instead of rendering these three things in their own requestAnimationFrame loop, I found that using a single request to render all three helped performance. This ensured 3D progress stayed in sync according to scroll calculations, and kept “repaints” to a minimum. There’s also a number of other best practices that I try to follow for all projects, as detailed elsewhere.
Scroll-Driven Interactivity
I’ve talked about scroll-driven interactives in my post on A Vanishing Aquifer, and this project uses many of the same techniques.
Instead of tracking scroll position when the user initiates the scroll, as Scrollmagic does, I use requestAnimationFrame to constantly check for changes in scroll position. This value happens to change when the user initiates the scroll. I’ve found that doing it this way leads to more reliable scroll tracking, and in turn a smoother animation that reacts directly to scroll position.
The page essentially uses the scroll position as a timeline, and if you’ve ever used Flash or After Effects, I set up behavior like a series of keyframes—transition some value for a prescribed duration at a moment along the timeline.
The project with a timeline debugging overlay
This transitioning, or tweening, is all coordinated by the Greensock Animation Platform (GSAP), a really nice to use and well documented tweening library. I have GSAP trigger changes in three.js 3D globe and camera properties, as well as HTML text visibility according to scroll position.
Setting up these transitions to not be nauseating or overly distracting was a big task, and I’m not sure I nailed every transition, especially on desktop. While the mobile experience is a simplified experience, there’s something to be said for transitioning all movement in a single column. As in, the text rolls in in the center, and the thing being animated is also in the center. On desktop it can be mentally taxing to track moving text in a left column, an animating globe to the right, all while thinking about constantly scrolling the experience.
If it’s so laborious to make (or possibly enjoy) a satisfying scroll-based experience, then why do it? While I like the fluid experience of directly animating according to scroll, there are those who think we shouldn’t do “scrollytelling.” There are certainly best practices for managing interactions, but the verdict is still out on whether it’s better than clicking a stepper. I think that’s because it’s not as simple as good or bad. The success of a user interface depends on how good it feels to experience, how well it performs, and in an editorial context, how well it serves a story being told.
Epilogue
The biggest challenges in projects like these are their interdisciplinary nature. As digital graphics editors, we strive for high standards on multiple fronts: appealing aesthetic design, a satisfying user experience across device sizes, accurate cartographic representation, and most fundamentally, presenting science accurately through narrative, illustration, and data visualization.
After some in-house user testing and some sessions on usertesting.com, we found that most people were able to successfully navigate and absorb the interactive, but I think we can keep pushing towards something that constitutes a fully satisfying scroll-driven experience.
Some technical hiccups remain in the project, namely performance problems with certain video cards, but I’m satisfied in how we were able to create a uniquely 3D browser-based experience of Mars. We stayed true to current scientific understanding to visualize Mars from a new perspective, as a truly alien planet.
Resources
Many of the technical challenges in this project were solved with the help of the internet. To create 3D graphics in the browser, the JavaScript library three.js is easier to approach than WebGL alone, but it asks a lot of the developer to know how to manipulate and position objects in 3D space. So I stand on the shoulders of many before me who have tried to figure this stuff out and have posted their answers and code examples in blog posts, StackOverflow, and graphics forums. Thank you, internet, it is through you I am able to create worlds across oceans of time.
As I did with Losing Ground and processing satellite imagery, I was able to use this project as a way to learn new tools and techniques, in this case, 3D graphics in the browser. This is a very satisfying way to work, and throughout my journey I compiled some resources that others might use to get started here, below. While three.js has good documentation, I found practical examples much more helpful. I encourage you to leave more resources in the comments.
General three.js resources and examples
- Official examples: https://threejs.org/examples/
- Stemkowski’s examples, also a great place to start: https://stemkoski.github.io/Three.js/index.html
- A lot of globe-based examples: http://callumprentice.github.io/
- Blog with code and inspiration: http://learningthreejs.com/
- Helpful extensions to use/learn from http://www.threejsgames.com/extensions/
- Boilerplate to get started with a three.js scene https://jeromeetienne.github.io/threejsboilerplatebuilder/
- Interactive 3D graphics online course. A good mix of 3D graphics principles and practical examples: https://www.udacity.com/course/interactive–3d-graphics–cs291
- Preloading assets with three.js http://benchung.com/loading-animation-three-js/
3D Globes
- Create a procedural planet using the cube-to-sphere technique, with code: https://open.bekk.no/procedural-planet-in-webgl-and-three-js
- Data on a globe:
- The solar system https://github.com/jeromeetienne/threex.planets/
- Creating earth, with code: http://blog.thematicmapping.org/2013/09/creating-webgl-earth-with-threejs.html
3D Maps
- Rendering a 3D terrain: http://blog.mastermaps.com/2013/11/showing-gps-tracks-in–3d-with-threejs.html
- Source article on a 3D terrain narrative:
- How it was made: https://source.opennews.org/en-US/articles/how-we-made–3d-tour-de-france/
- With entire codebase: https://github.com/guardian/interactive-tour-de-france–2015
- Project with debugging tool activated!: https://www.theguardian.com/sport/ng-interactive/2015/jul/23/tour-de-france-the-climb-of-alpe-dhuez-interactive?debug
- QGIS plugin to generate three.js from GIS: http://qgis2threejs.readthedocs.io/
- LA times 3D Mars interactive, with code: http://graphics.latimes.com/mars-gale-crater-how-we-did-it/
3D Object Manipulation
- Vertex displacement, the concept behind the cube-to-sphere technique: https://www.clicktorelease.com/blog/vertex-displacement-noise–3d-webgl-glsl-three-js
- Moving the camera to fit objects (aka, how to make a sphere fit a browser window):
Organizations
Credits
-
 Brian Jacobs
Brian Jacobs is a Senior Graphics Editor who designs and develops interactive maps and graphics for National Geographic Magazine. Brian uses open source visualization and data processing tools to create and envision custom editorial experiences across platforms. He was previously a Knight-Mozilla fellow at ProPublica, where he worked on “Losing Ground”, an interactive story about the slow-motion environmental catastrophe taking place in southeast Louisiana. Find him at @btjakes.


